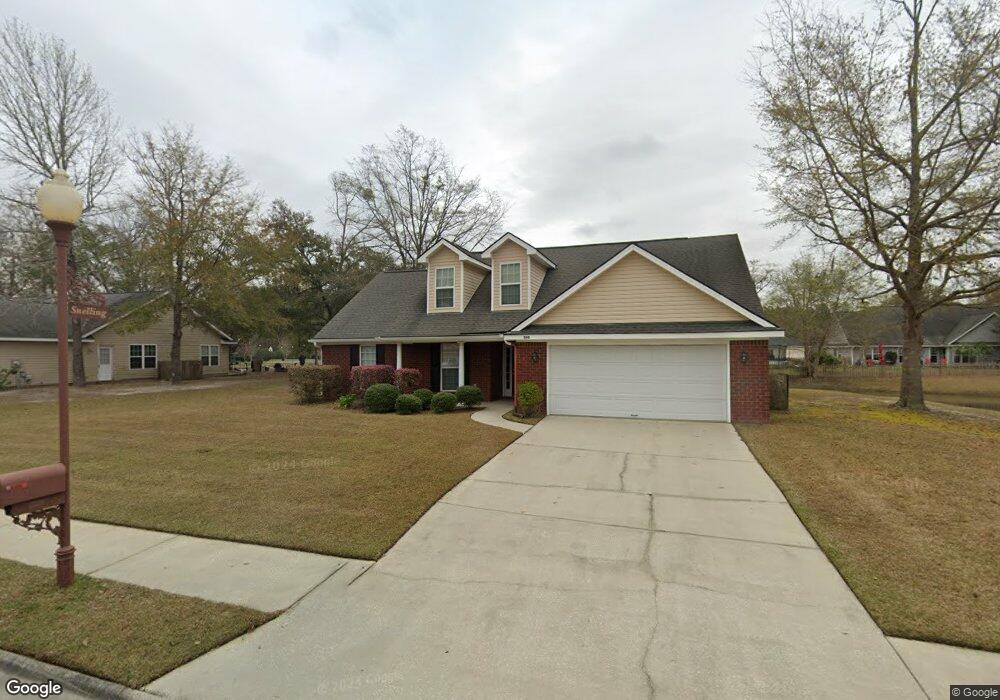
540 Cobblestone Cir Bloomingdale, GA 31302
Estimated Value: $312,409 - $355,000
3
Beds
2
Baths
1,637
Sq Ft
$207/Sq Ft
Est. Value
About This Home
This home is located at 540 Cobblestone Cir, Bloomingdale, GA 31302 and is currently estimated at $339,352, approximately $207 per square foot. 540 Cobblestone Cir is a home located in Effingham County with nearby schools including Sand Hill Elementary School, South Effingham Middle School, and South Effingham High School.
Ownership History
Date
Name
Owned For
Owner Type
Purchase Details
Closed on
Feb 27, 2012
Sold by
Federal Home Loan Mortgage Corporation
Bought by
Snelling Cathy Lynn
Current Estimated Value
Home Financials for this Owner
Home Financials are based on the most recent Mortgage that was taken out on this home.
Original Mortgage
$107,200
Outstanding Balance
$73,297
Interest Rate
4%
Mortgage Type
New Conventional
Estimated Equity
$266,055
Purchase Details
Closed on
Sep 6, 2011
Sold by
Suntrust Mortgage Inc
Bought by
Federal Home Loan Mortgage Corporation
Purchase Details
Closed on
Jun 14, 2006
Sold by
Wade Victoria Mormile
Bought by
Hollis Jerimee Jay
Home Financials for this Owner
Home Financials are based on the most recent Mortgage that was taken out on this home.
Original Mortgage
$160,800
Interest Rate
6.63%
Mortgage Type
New Conventional
Create a Home Valuation Report for This Property
The Home Valuation Report is an in-depth analysis detailing your home's value as well as a comparison with similar homes in the area
Home Values in the Area
Average Home Value in this Area
Purchase History
| Date | Buyer | Sale Price | Title Company |
|---|---|---|---|
| Snelling Cathy Lynn | $134,000 | -- | |
| Federal Home Loan Mortgage Corporation | $132,600 | -- | |
| Federal Home Loan Mortgage Corporation | $132,590 | -- | |
| Suntrust Mortgage Inc | $132,590 | -- | |
| Hollis Jerimee Jay | -- | -- | |
| Hollis Jerimee J | $201,000 | -- | |
| Dhc Inc | $148,174 | -- |
Source: Public Records
Mortgage History
| Date | Status | Borrower | Loan Amount |
|---|---|---|---|
| Open | Snelling Cathy Lynn | $107,200 | |
| Previous Owner | Dhc Inc | $160,800 |
Source: Public Records
Tax History Compared to Growth
Tax History
| Year | Tax Paid | Tax Assessment Tax Assessment Total Assessment is a certain percentage of the fair market value that is determined by local assessors to be the total taxable value of land and additions on the property. | Land | Improvement |
|---|---|---|---|---|
| 2025 | $2,199 | $121,869 | $24,800 | $97,069 |
| 2024 | $2,199 | $108,345 | $24,800 | $83,545 |
| 2023 | $1,426 | $109,122 | $18,000 | $91,122 |
| 2022 | $1,907 | $84,436 | $14,800 | $69,636 |
| 2021 | $1,855 | $78,382 | $14,000 | $64,382 |
| 2020 | $1,829 | $74,435 | $14,000 | $60,435 |
| 2019 | $1,837 | $71,635 | $11,200 | $60,435 |
| 2018 | $1,807 | $65,250 | $11,200 | $54,050 |
| 2017 | $1,819 | $65,250 | $11,200 | $54,050 |
| 2016 | $1,742 | $64,826 | $11,200 | $53,626 |
| 2015 | -- | $62,826 | $9,200 | $53,626 |
| 2014 | -- | $62,826 | $9,200 | $53,626 |
| 2013 | -- | $64,825 | $11,200 | $53,625 |
Source: Public Records
Map
Nearby Homes
- 507 Cobblestone Cir
- 511 Cobblestone Cir
- 104 Sandstone Dr
- 124 Harvey Rd
- 251 Oak Dr
- 205 Oak Dr
- 176 E 7th St
- 208 Cypress Lake Dr
- 160 8th St
- 444 Harvey Rd
- 195 Railroad St
- Tract 2 Williams St
- 225 Oconee Ave
- 472 S Laurel Cir
- 101 Buford Hill Rd
- 2060 Us Highway 80
- 338 Bay
- 218 Ridge Rd
- 2301 US Highway 80
- 327 Bay Ln
- 542 Cobblestone Cir
- 529 Cobblestone Cir
- 600 Ballaststone Cir
- 531 Cobblestone Cir
- 602 Ballaststone Cir
- 602 Ballastone Cir
- 527 Cobblestone Cir
- 604 Ballaststone Cir
- 503 Cobblestone Cir
- 604 Ballastone Cir
- 525 Cobblestone Cir
- 501 Cobblestone Cir
- 505 Cobblestone Cir
- 601 Ballastone
- 601 Ballaststone Cir
- 606 Ballaststone Cir
- 606 Ballastone Cir
- 538 Cobblestone Cir
- 625 Ballaststone Cir
- 509 Cobblestone Cir