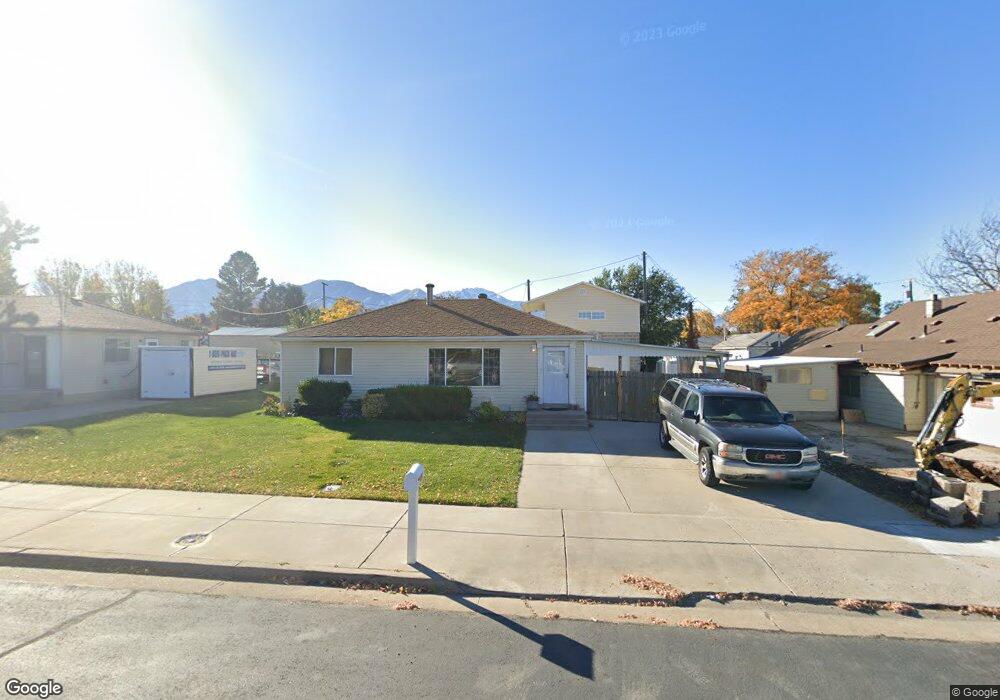
540 E 500 N Unit 11 Spanish Fork, UT 84660
Estimated Value: $370,000 - $387,000
3
Beds
1
Bath
962
Sq Ft
$393/Sq Ft
Est. Value
About This Home
This home is located at 540 E 500 N Unit 11, Spanish Fork, UT 84660 and is currently estimated at $378,208, approximately $393 per square foot. 540 E 500 N Unit 11 is a home located in Utah County with nearby schools including Park Elementary School, Spanish Fork Jr High School, and Spanish Fork High School.
Ownership History
Date
Name
Owned For
Owner Type
Purchase Details
Closed on
Jul 7, 2020
Sold by
Taylor Neil S and Taylor Susan L
Bought by
N & S Taylor Properties Llc
Current Estimated Value
Purchase Details
Closed on
Feb 17, 2016
Sold by
Anderson Boas
Bought by
Taylor Neil S and Taylor Susan L
Home Financials for this Owner
Home Financials are based on the most recent Mortgage that was taken out on this home.
Original Mortgage
$126,000
Outstanding Balance
$100,510
Interest Rate
3.97%
Mortgage Type
New Conventional
Estimated Equity
$277,698
Purchase Details
Closed on
Sep 12, 2006
Sold by
Shepherd Kent L and Shepherd Kathie L
Bought by
Anderson Boas
Home Financials for this Owner
Home Financials are based on the most recent Mortgage that was taken out on this home.
Original Mortgage
$132,000
Interest Rate
3.98%
Mortgage Type
New Conventional
Create a Home Valuation Report for This Property
The Home Valuation Report is an in-depth analysis detailing your home's value as well as a comparison with similar homes in the area
Home Values in the Area
Average Home Value in this Area
Purchase History
| Date | Buyer | Sale Price | Title Company |
|---|---|---|---|
| N & S Taylor Properties Llc | -- | Keyland Title | |
| Taylor Neil S | -- | Title West | |
| Anderson Boas | -- | Title West |
Source: Public Records
Mortgage History
| Date | Status | Borrower | Loan Amount |
|---|---|---|---|
| Open | Taylor Neil S | $126,000 | |
| Previous Owner | Anderson Boas | $132,000 |
Source: Public Records
Tax History
| Year | Tax Paid | Tax Assessment Tax Assessment Total Assessment is a certain percentage of the fair market value that is determined by local assessors to be the total taxable value of land and additions on the property. | Land | Improvement |
|---|---|---|---|---|
| 2025 | $1,588 | $186,395 | -- | -- |
| 2024 | $1,588 | $163,680 | $0 | $0 |
| 2023 | $1,594 | $164,505 | $0 | $0 |
| 2022 | $1,791 | $181,225 | $0 | $0 |
| 2021 | $1,572 | $254,500 | $84,200 | $170,300 |
| 2020 | $1,421 | $223,600 | $70,200 | $153,400 |
| 2019 | $1,229 | $203,600 | $70,200 | $133,400 |
| 2018 | $1,204 | $192,700 | $70,200 | $122,500 |
| 2017 | $1,156 | $99,440 | $0 | $0 |
| 2016 | $1,066 | $90,530 | $0 | $0 |
| 2015 | $824 | $69,135 | $0 | $0 |
| 2014 | $762 | $64,130 | $0 | $0 |
Source: Public Records
Map
Nearby Homes
- 590 N 400 E
- 374 N 500 E
- 330 E 700 N
- 284 N 400 E
- 440 N 200 E
- 235 E 900 N
- 136 E 900 N
- 284 N 1000 E
- 1050 E 800 N Unit 1
- 1050 E 800 N Unit 5
- 1074 E 660 N
- 314 N 1070 E
- 306 N 1070 E
- 306 N 1070 E Unit 17
- 274 N 1070 E Unit 14
- 299 N 1070 E Unit 8
- 212 N 1070 E Unit 9
- 224 N 1070 E Unit 10
- 998 E 260 N Unit 16
- 992 E 260 N Unit 15
Your Personal Tour Guide
Ask me questions while you tour the home.