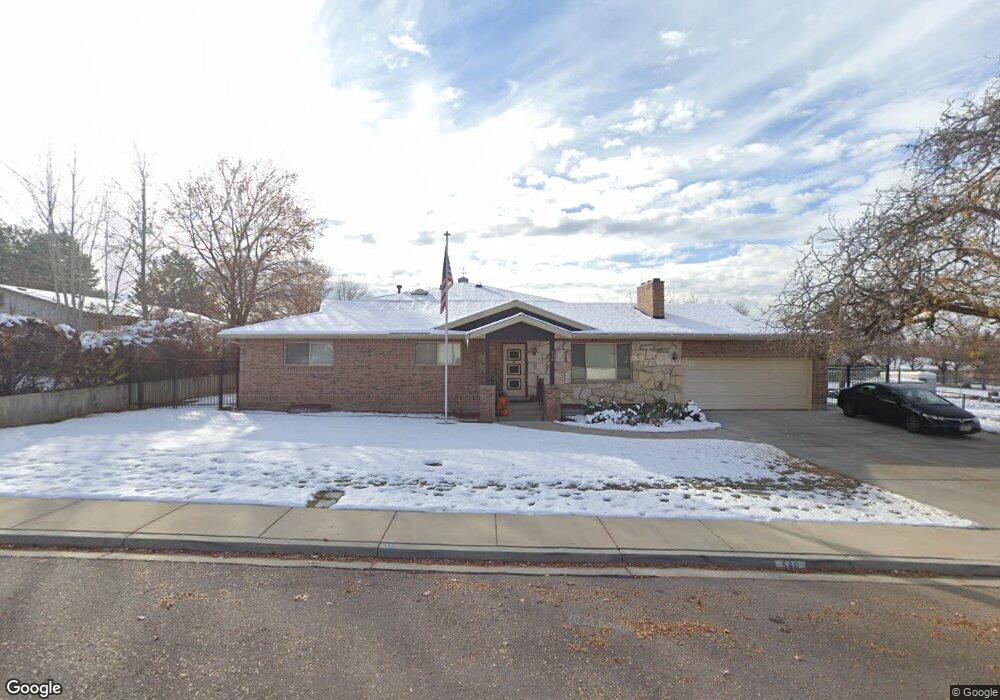
540 E 700 N Pleasant Grove, UT 84062
Estimated Value: $812,249 - $916,000
4
Beds
3
Baths
3,180
Sq Ft
$266/Sq Ft
Est. Value
About This Home
This home is located at 540 E 700 N, Pleasant Grove, UT 84062 and is currently estimated at $846,312, approximately $266 per square foot. 540 E 700 N is a home located in Utah County with nearby schools including Grovecrest Elementary School, Pleasant Grove Junior High School, and Pleasant Grove High School.
Ownership History
Date
Name
Owned For
Owner Type
Purchase Details
Closed on
Aug 15, 2022
Sold by
Homestead Holding Trust and Jackson Susan
Bought by
Leslie & Nancy Southam Family Trust and Southam
Current Estimated Value
Purchase Details
Closed on
Apr 25, 2005
Sold by
Southam Leslie and Southam Nancy
Bought by
Jackson Susan
Home Financials for this Owner
Home Financials are based on the most recent Mortgage that was taken out on this home.
Original Mortgage
$146,886
Interest Rate
5.92%
Mortgage Type
Fannie Mae Freddie Mac
Create a Home Valuation Report for This Property
The Home Valuation Report is an in-depth analysis detailing your home's value as well as a comparison with similar homes in the area
Home Values in the Area
Average Home Value in this Area
Purchase History
| Date | Buyer | Sale Price | Title Company |
|---|---|---|---|
| Leslie & Nancy Southam Family Trust | -- | None Listed On Document | |
| Jackson Susan | -- | Backman Stewart Title Servic | |
| Southam Leslie | -- | Backman Stewart Title Servic |
Source: Public Records
Mortgage History
| Date | Status | Borrower | Loan Amount |
|---|---|---|---|
| Previous Owner | Southam Leslie | $146,886 |
Source: Public Records
Tax History Compared to Growth
Tax History
| Year | Tax Paid | Tax Assessment Tax Assessment Total Assessment is a certain percentage of the fair market value that is determined by local assessors to be the total taxable value of land and additions on the property. | Land | Improvement |
|---|---|---|---|---|
| 2025 | $3,290 | $385,000 | $282,900 | $417,100 |
| 2024 | $3,290 | $392,865 | $0 | $0 |
| 2023 | $3,299 | $403,040 | $0 | $0 |
| 2022 | $3,552 | $431,860 | $0 | $0 |
| 2021 | $3,072 | $568,700 | $202,900 | $365,800 |
| 2020 | $2,831 | $513,700 | $181,200 | $332,500 |
| 2019 | $2,659 | $499,000 | $166,500 | $332,500 |
| 2018 | $2,555 | $453,300 | $151,800 | $301,500 |
| 2017 | $2,268 | $214,225 | $0 | $0 |
| 2016 | $2,025 | $184,635 | $0 | $0 |
| 2015 | $1,949 | $168,300 | $0 | $0 |
| 2014 | $1,949 | $166,705 | $0 | $0 |
Source: Public Records
Map
Nearby Homes