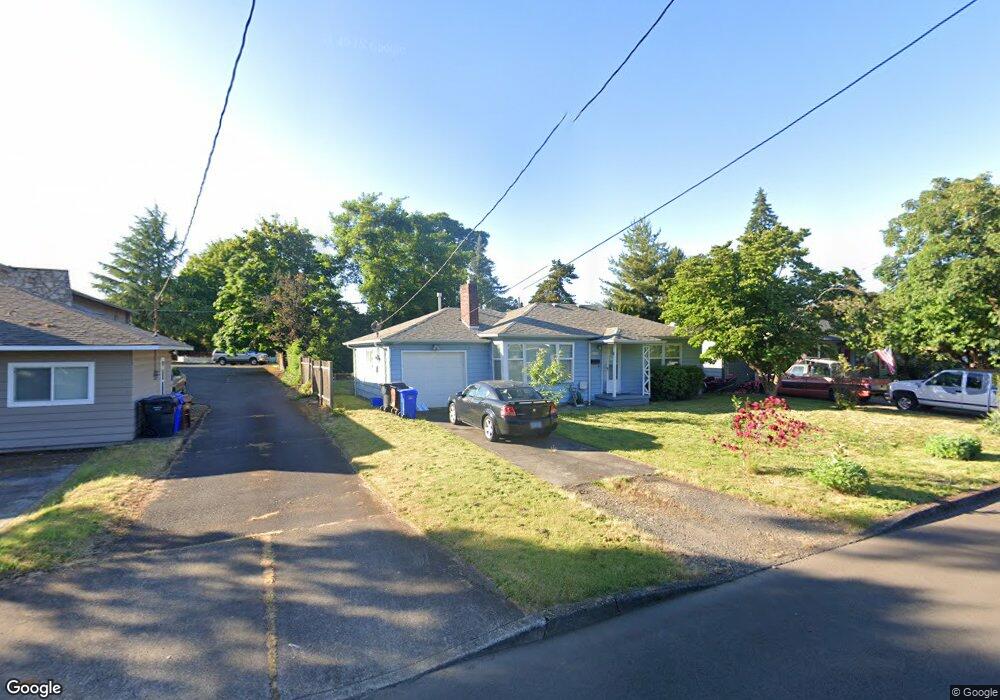
540 E Berkeley St Gladstone, OR 97027
Estimated Value: $387,460 - $446,000
2
Beds
1
Bath
840
Sq Ft
$494/Sq Ft
Est. Value
About This Home
This home is located at 540 E Berkeley St, Gladstone, OR 97027 and is currently estimated at $415,365, approximately $494 per square foot. 540 E Berkeley St is a home located in Clackamas County with nearby schools including John Wetten Elementary School, Walter L Kraxberger Middle School, and Gladstone High School.
Ownership History
Date
Name
Owned For
Owner Type
Purchase Details
Closed on
Sep 26, 2012
Sold by
Craytor Richard D and Craytor Denise A
Bought by
Cereghino Nicholas J
Current Estimated Value
Home Financials for this Owner
Home Financials are based on the most recent Mortgage that was taken out on this home.
Original Mortgage
$141,075
Outstanding Balance
$97,362
Interest Rate
3.59%
Mortgage Type
New Conventional
Estimated Equity
$318,003
Purchase Details
Closed on
Jun 26, 2002
Sold by
Dyas Kelleen A and Dyas Kelly A
Bought by
Craytor Richard D and Craytor Denise A
Home Financials for this Owner
Home Financials are based on the most recent Mortgage that was taken out on this home.
Original Mortgage
$94,800
Interest Rate
6.78%
Purchase Details
Closed on
Jun 6, 2002
Sold by
Jordan Mary Donna Lee and Jordan Leonard Harold
Bought by
Dyas Kelleen A
Home Financials for this Owner
Home Financials are based on the most recent Mortgage that was taken out on this home.
Original Mortgage
$94,800
Interest Rate
6.78%
Create a Home Valuation Report for This Property
The Home Valuation Report is an in-depth analysis detailing your home's value as well as a comparison with similar homes in the area
Home Values in the Area
Average Home Value in this Area
Purchase History
| Date | Buyer | Sale Price | Title Company |
|---|---|---|---|
| Cereghino Nicholas J | $156,750 | First Amer Title Ins Co Or | |
| Craytor Richard D | $120,000 | First American | |
| Dyas Kelleen A | -- | First American |
Source: Public Records
Mortgage History
| Date | Status | Borrower | Loan Amount |
|---|---|---|---|
| Open | Cereghino Nicholas J | $141,075 | |
| Previous Owner | Craytor Richard D | $94,800 |
Source: Public Records
Tax History
| Year | Tax Paid | Tax Assessment Tax Assessment Total Assessment is a certain percentage of the fair market value that is determined by local assessors to be the total taxable value of land and additions on the property. | Land | Improvement |
|---|---|---|---|---|
| 2025 | $3,739 | $185,575 | -- | -- |
| 2024 | $3,635 | $180,170 | -- | -- |
| 2023 | $3,635 | $174,923 | $0 | $0 |
| 2022 | $3,381 | $169,829 | $0 | $0 |
| 2021 | $3,257 | $164,883 | $0 | $0 |
| 2020 | $3,179 | $160,081 | $0 | $0 |
| 2019 | $3,142 | $155,419 | $0 | $0 |
| 2018 | $3,028 | $150,892 | $0 | $0 |
| 2017 | $2,937 | $146,497 | $0 | $0 |
| 2016 | $2,841 | $142,230 | $0 | $0 |
Source: Public Records
Map
Nearby Homes
- 325 E Arlington St
- 480 E Gloucester St
- 515 E Hereford St
- 1065 Columbia Ave
- 119 E Jersey St
- 115 E Jersey St
- 14000 Forsythe Rd Unit 1
- 620 Barbary Ct
- 1460 Cornell Ave
- 330 W Dartmouth St
- 16153 Barlow Trail Ln
- 280 Ipswich St
- 390 W Arlington St
- 16079 Serres Farms Rd
- 15752 Godon Way
- 16108 Serres Farms Rd
- 700 Barton Ave Unit 1
- 280 Nelson Ln
- 441 W Gloucester St
- 140 Nelson Ln
- 550 E Berkeley St
- E E Berkeley St
- 510 E Berkeley St
- 535 E Clarendon St
- 545 E Clarendon St
- 560 E Berkeley St
- 555 E Clarendon St
- 525 E Berkeley St
- 535 E Berkeley St
- 570 E Berkeley St
- 515 E Berkeley St
- 545 E Berkeley St
- 565 E Clarendon St
- 555 E Berkeley St
- 480 E Berkeley St
- 380 Cornell Ave
- 575 E Clarendon St
- 540 E Arlington St
- 534 E Clarendon St
- 520 E Arlington St
Your Personal Tour Guide
Ask me questions while you tour the home.