Estimated Value: $650,000 - $752,000
7
Beds
4
Baths
4,310
Sq Ft
$163/Sq Ft
Est. Value
About This Home
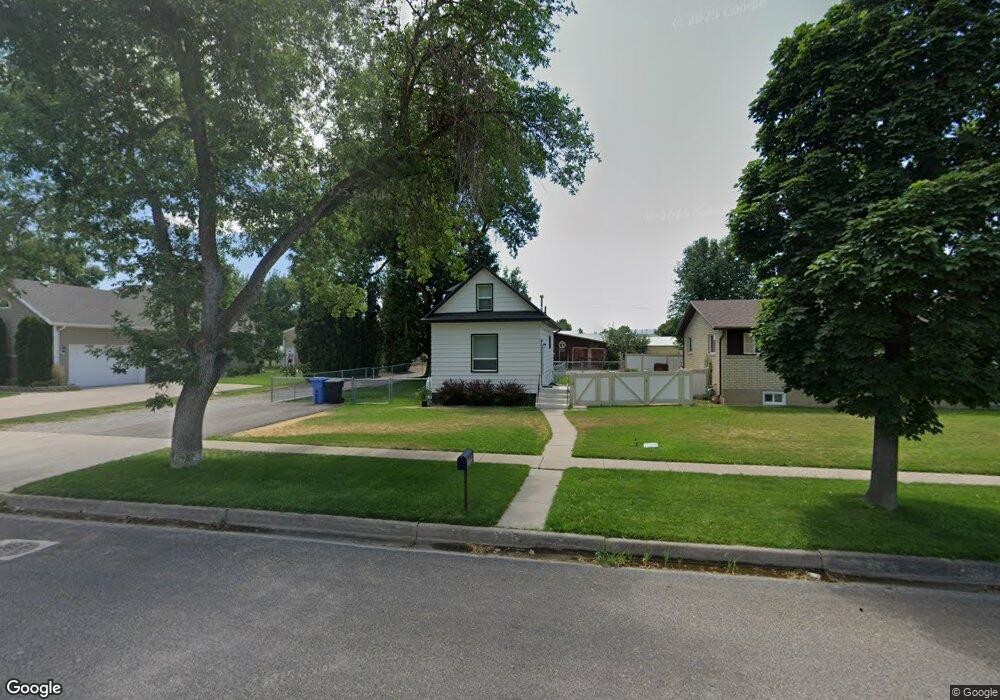
This home is located at 540 E Main St, Hyrum, UT 84319 and is currently estimated at $703,642, approximately $163 per square foot. 540 E Main St is a home located in Cache County with nearby schools including Millville School, South Cache Middle School, and Mountain Crest High School.
Ownership History
Date
Name
Owned For
Owner Type
Purchase Details
Closed on
Jan 2, 2020
Sold by
540 East Main Llc
Bought by
540 East Main Llc
Current Estimated Value
Purchase Details
Closed on
Nov 21, 2019
Sold by
Gines Brent C and Kimball Diane L
Bought by
540 Soth Main Llc
Purchase Details
Closed on
Apr 22, 2011
Sold by
Gines Brent C and Kimball Diane L
Bought by
Gines Brent C and Kimball Diane L
Home Financials for this Owner
Home Financials are based on the most recent Mortgage that was taken out on this home.
Original Mortgage
$165,000
Interest Rate
4.83%
Mortgage Type
New Conventional
Purchase Details
Closed on
May 7, 2001
Sold by
Speth Tony
Bought by
Speth Tony
Create a Home Valuation Report for This Property
The Home Valuation Report is an in-depth analysis detailing your home's value as well as a comparison with similar homes in the area
Home Values in the Area
Average Home Value in this Area
Purchase History
| Date | Buyer | Sale Price | Title Company |
|---|---|---|---|
| 540 East Main Llc | -- | None Available | |
| 540 Soth Main Llc | -- | None Available | |
| Gines Brent C | -- | Deer Creek Title Ins Inc | |
| Gines Brent C | -- | Deer Creek Title Ins Inc | |
| Speth Tony | -- | -- |
Source: Public Records
Mortgage History
| Date | Status | Borrower | Loan Amount |
|---|---|---|---|
| Previous Owner | Gines Brent C | $165,000 |
Source: Public Records
Tax History Compared to Growth
Tax History
| Year | Tax Paid | Tax Assessment Tax Assessment Total Assessment is a certain percentage of the fair market value that is determined by local assessors to be the total taxable value of land and additions on the property. | Land | Improvement |
|---|---|---|---|---|
| 2025 | $2,718 | $390,190 | $0 | $0 |
| 2024 | $2,917 | $391,080 | $0 | $0 |
| 2023 | $2,757 | $353,475 | $0 | $0 |
| 2022 | $2,865 | $352,015 | $0 | $0 |
| 2021 | $2,853 | $508,640 | $152,000 | $356,640 |
| 2020 | $2,728 | $453,100 | $152,000 | $301,100 |
| 2019 | $1,830 | $286,232 | $69,050 | $217,182 |
| 2018 | $1,706 | $256,154 | $69,050 | $187,104 |
| 2017 | $1,691 | $141,725 | $0 | $0 |
| 2016 | $1,729 | $141,725 | $0 | $0 |
| 2015 | $1,734 | $141,725 | $0 | $0 |
| 2014 | $1,595 | $133,345 | $0 | $0 |
| 2013 | -- | $133,345 | $0 | $0 |
Source: Public Records
Map
Nearby Homes