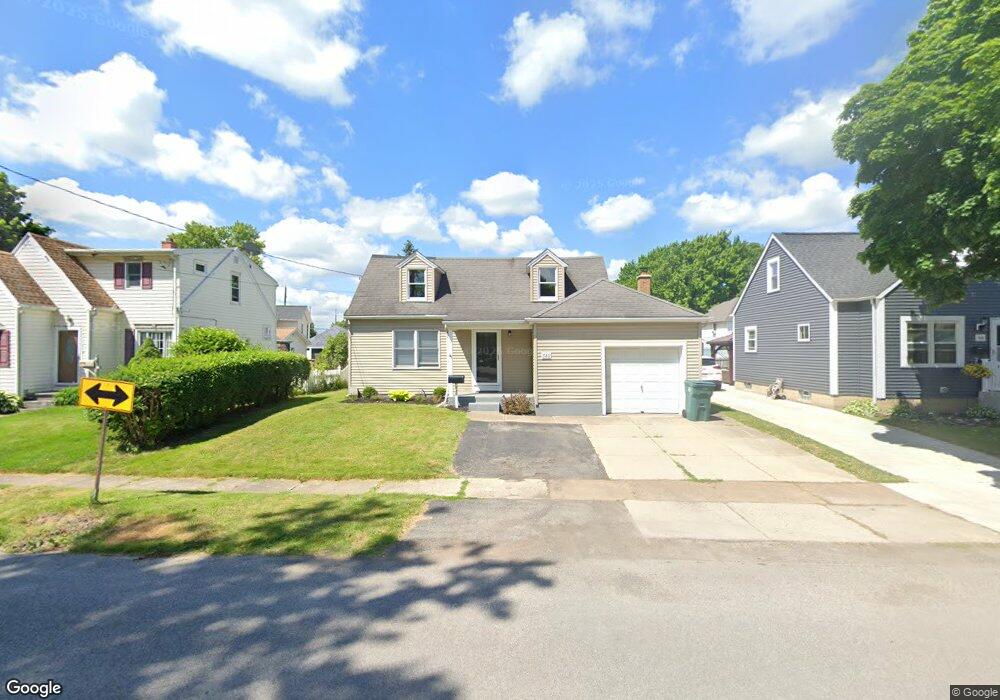
540 Gilmore Ave North Tonawanda, NY 14120
Estimated Value: $182,000 - $202,582
3
Beds
2
Baths
1,155
Sq Ft
$165/Sq Ft
Est. Value
About This Home
This home is located at 540 Gilmore Ave, North Tonawanda, NY 14120 and is currently estimated at $191,146, approximately $165 per square foot. 540 Gilmore Ave is a home located in Niagara County with nearby schools including North Tonawanda Intermediate School and St Matthew Lutheran School.
Ownership History
Date
Name
Owned For
Owner Type
Purchase Details
Closed on
Jan 6, 2018
Sold by
Tylec Gail Louise and Tylec John Stanley
Bought by
Rosen Gabriele M
Current Estimated Value
Home Financials for this Owner
Home Financials are based on the most recent Mortgage that was taken out on this home.
Original Mortgage
$82,650
Outstanding Balance
$69,747
Interest Rate
3.94%
Mortgage Type
New Conventional
Estimated Equity
$121,399
Purchase Details
Closed on
May 17, 2017
Sold by
Hsbc Bank Usa Na
Bought by
Tylec Gail Louise and Tylec John Stanley
Purchase Details
Closed on
Feb 22, 2017
Sold by
Wells Fargo Bank Na
Bought by
Hsbc Bank Usa Na
Purchase Details
Closed on
Mar 20, 1997
Sold by
Urban James M and Urban Lesley M
Bought by
Cheehan Kathryn
Create a Home Valuation Report for This Property
The Home Valuation Report is an in-depth analysis detailing your home's value as well as a comparison with similar homes in the area
Home Values in the Area
Average Home Value in this Area
Purchase History
| Date | Buyer | Sale Price | Title Company |
|---|---|---|---|
| Rosen Gabriele M | $87,000 | -- | |
| Tylec Gail Louise | $55,555 | None Available | |
| Hsbc Bank Usa Na | $74,000 | None Available | |
| Cheehan Kathryn | $63,000 | -- |
Source: Public Records
Mortgage History
| Date | Status | Borrower | Loan Amount |
|---|---|---|---|
| Open | Rosen Gabriele M | $82,650 |
Source: Public Records
Tax History Compared to Growth
Tax History
| Year | Tax Paid | Tax Assessment Tax Assessment Total Assessment is a certain percentage of the fair market value that is determined by local assessors to be the total taxable value of land and additions on the property. | Land | Improvement |
|---|---|---|---|---|
| 2024 | $2,630 | $74,500 | $13,000 | $61,500 |
| 2023 | $2,565 | $74,500 | $13,000 | $61,500 |
| 2022 | $2,537 | $74,500 | $13,000 | $61,500 |
| 2021 | $2,520 | $74,500 | $13,000 | $61,500 |
| 2020 | $2,467 | $74,500 | $13,000 | $61,500 |
| 2019 | $510 | $74,500 | $13,000 | $61,500 |
| 2018 | $2,458 | $74,500 | $13,000 | $61,500 |
| 2017 | $1,950 | $60,000 | $13,000 | $47,000 |
| 2016 | $2,369 | $74,200 | $13,000 | $61,200 |
| 2015 | -- | $74,200 | $13,000 | $61,200 |
| 2014 | -- | $74,200 | $13,000 | $61,200 |
Source: Public Records
Map
Nearby Homes
- 544 Gilmore Ave
- 534 Gilmore Ave
- 47 Dahlgreen Place
- 53 Dahlgreen Place
- 528 Gilmore Ave
- 55 Dahlgreen Place
- 244 Shartle Place
- 554 Gilmore Ave
- 61 Dahlgreen Place
- 243 Shartle Place
- 248 Shartle Place
- 35 Dahlgreen Place
- 558 Gilmore Ave
- 65 Dahlgreen Place
- 16 Chipman Place
- 167 Lindsay Place
- 247 Shartle Place
- 33 Dahlgreen Place
- 252 Shartle Place
- 67 Dahlgreen Place