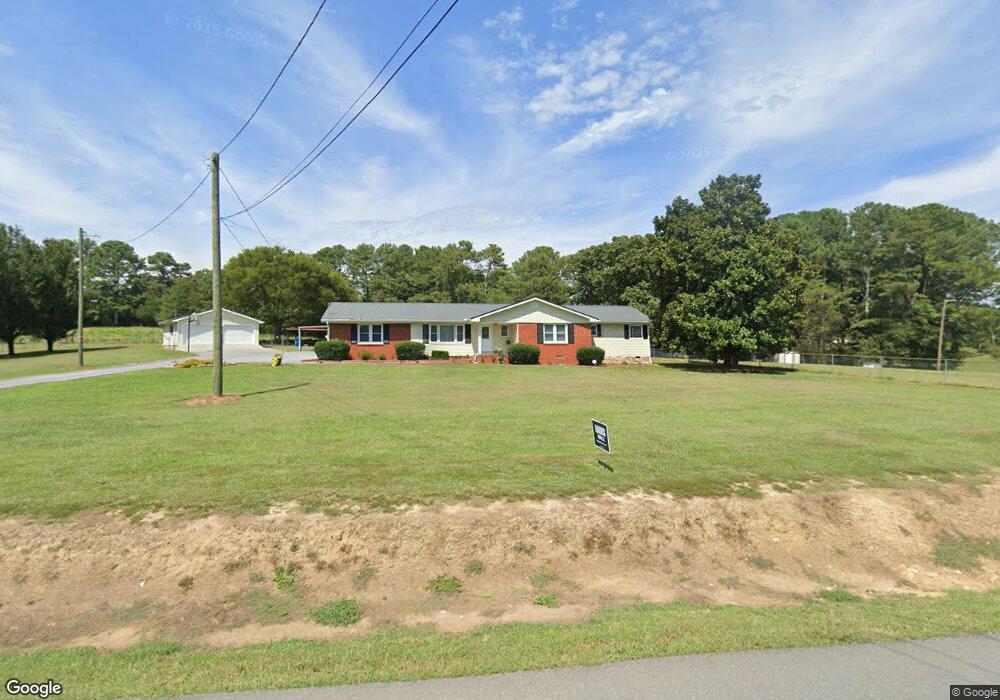
540 Gravely Rd SE Calhoun, GA 30701
Estimated Value: $222,000 - $284,000
4
Beds
3
Baths
2,069
Sq Ft
$126/Sq Ft
Est. Value
About This Home
This home is located at 540 Gravely Rd SE, Calhoun, GA 30701 and is currently estimated at $260,052, approximately $125 per square foot. 540 Gravely Rd SE is a home located in Gordon County with nearby schools including Sonoraville Elementary School, Red Bud Middle School, and Sonoraville High School.
Ownership History
Date
Name
Owned For
Owner Type
Purchase Details
Closed on
Oct 15, 2024
Sold by
Thorpe Kingsley
Bought by
Thorpe Living Trust September 18 2024
Current Estimated Value
Purchase Details
Closed on
Aug 2, 2022
Sold by
Chattam Judy C
Bought by
Thorpe Miranda and Thorpe Kingsley
Home Financials for this Owner
Home Financials are based on the most recent Mortgage that was taken out on this home.
Original Mortgage
$140,000
Interest Rate
3.75%
Mortgage Type
New Conventional
Purchase Details
Closed on
Jul 19, 2021
Sold by
Chattam John S
Bought by
Chattam Judy C
Purchase Details
Closed on
Oct 26, 2017
Sold by
Chattam John S
Bought by
Chattam John S and Chattam Judy S
Home Financials for this Owner
Home Financials are based on the most recent Mortgage that was taken out on this home.
Original Mortgage
$143,600
Interest Rate
3.83%
Mortgage Type
VA
Create a Home Valuation Report for This Property
The Home Valuation Report is an in-depth analysis detailing your home's value as well as a comparison with similar homes in the area
Home Values in the Area
Average Home Value in this Area
Purchase History
| Date | Buyer | Sale Price | Title Company |
|---|---|---|---|
| Thorpe Living Trust September 18 2024 | -- | -- | |
| Thorpe Miranda | $175,000 | -- | |
| Chattam Judy C | -- | -- | |
| Chattam John S | -- | -- |
Source: Public Records
Mortgage History
| Date | Status | Borrower | Loan Amount |
|---|---|---|---|
| Previous Owner | Thorpe Miranda | $140,000 | |
| Previous Owner | Chattam John S | $143,600 |
Source: Public Records
Tax History Compared to Growth
Tax History
| Year | Tax Paid | Tax Assessment Tax Assessment Total Assessment is a certain percentage of the fair market value that is determined by local assessors to be the total taxable value of land and additions on the property. | Land | Improvement |
|---|---|---|---|---|
| 2024 | $1,971 | $77,568 | $8,160 | $69,408 |
| 2023 | $1,778 | $72,968 | $8,160 | $64,808 |
| 2022 | $1,958 | $68,328 | $8,160 | $60,168 |
| 2021 | $1,510 | $52,688 | $4,200 | $48,488 |
| 2020 | $1,541 | $53,488 | $4,200 | $49,288 |
| 2019 | $1,601 | $53,488 | $4,200 | $49,288 |
| 2018 | $0 | $51,272 | $4,200 | $47,072 |
| 2017 | $458 | $48,632 | $4,200 | $44,432 |
| 2016 | $459 | $48,632 | $4,200 | $44,432 |
| 2015 | $449 | $47,152 | $4,200 | $42,952 |
| 2014 | $422 | $45,228 | $4,200 | $41,028 |
Source: Public Records
Map
Nearby Homes
- 254 Gravely Rd SE
- 106 Valley View Cir SE
- 3171 Dews Pond Rd SE
- 140 Washington St SE
- 221 Hunters Crossing SE
- 225 Lovebridge Dr SE
- 320 Wrights Hollow Rd SE
- 219 Orchard Way SE
- 137 Orchard Way SE
- 279 Baker Rd SE
- 130 Orchard Way SE
- 137 Wendy Hill Rd SE
- 119 Windy Hill Rd SE
- 170 Erica Ln SE
- 170 Willow Haven St SE
- 187 Willow Haven St SE
- 130 Burnt Hickory Ln SE
- 379 Owens Cir NE
- 137 Hunters Trail SE
- 549 Gravely Rd SE
- 472 Gravely Rd SE
- 495 Gravely Rd SE
- 414 Gravely Rd SE
- 408 Gravely Rd SE
- 400 Gravely Rd SE
- 574 Gravely Rd SE
- 587 Gravely Rd SE
- 413 Gravely Rd SE
- 378 Gravely Rd SE
- 221 Circle Valley Dr SE
- 407 Gravely Rd SE
- 364 Gravely Rd SE
- 403 Gravely Rd SE
- 211 Circle Valley Dr SE
- 350 Gravely Rd SE
- 568 Gravely Rd SE
- 568 Gravely Rd SE
- 568 Gravely Rd SE
- 208 Circle Valley Dr SE