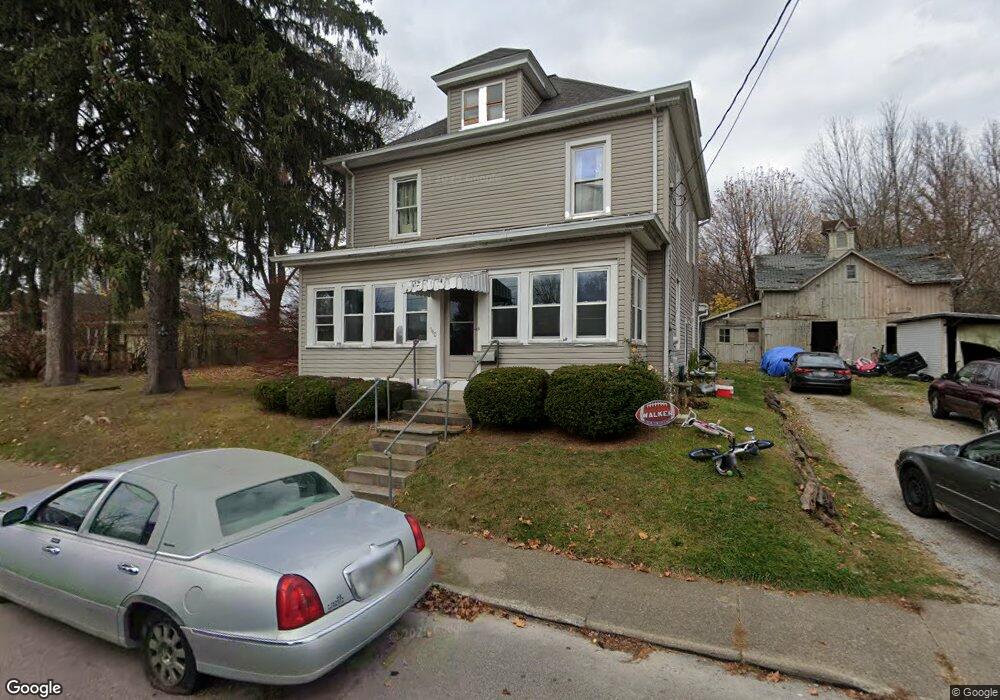
540 High St Wooster, OH 44691
Estimated Value: $180,983 - $203,000
4
Beds
2
Baths
1,982
Sq Ft
$97/Sq Ft
Est. Value
About This Home
This home is located at 540 High St, Wooster, OH 44691 and is currently estimated at $191,996, approximately $96 per square foot. 540 High St is a home located in Wayne County with nearby schools including Cornerstone Elementary School, Edgewood Middle School, and Wooster High School.
Ownership History
Date
Name
Owned For
Owner Type
Purchase Details
Closed on
Aug 18, 1998
Sold by
Hitchcock Kenneth
Bought by
Holcomb Jason N and Holcomb Teresa M
Current Estimated Value
Home Financials for this Owner
Home Financials are based on the most recent Mortgage that was taken out on this home.
Original Mortgage
$59,655
Outstanding Balance
$11,295
Interest Rate
7.07%
Mortgage Type
New Conventional
Estimated Equity
$180,701
Purchase Details
Closed on
Jan 7, 1993
Sold by
Hitchcock Kenneth and Hitchcock Noble
Bought by
Hitchcock Kenneth and Hitchcock Evely
Create a Home Valuation Report for This Property
The Home Valuation Report is an in-depth analysis detailing your home's value as well as a comparison with similar homes in the area
Home Values in the Area
Average Home Value in this Area
Purchase History
| Date | Buyer | Sale Price | Title Company |
|---|---|---|---|
| Holcomb Jason N | $61,500 | -- | |
| Hitchcock Kenneth | -- | -- |
Source: Public Records
Mortgage History
| Date | Status | Borrower | Loan Amount |
|---|---|---|---|
| Open | Holcomb Jason N | $59,655 |
Source: Public Records
Tax History
| Year | Tax Paid | Tax Assessment Tax Assessment Total Assessment is a certain percentage of the fair market value that is determined by local assessors to be the total taxable value of land and additions on the property. | Land | Improvement |
|---|---|---|---|---|
| 2024 | $1,702 | $41,170 | $10,710 | $30,460 |
| 2023 | $1,709 | $41,170 | $10,710 | $30,460 |
| 2022 | $1,761 | $33,750 | $8,780 | $24,970 |
| 2021 | $1,817 | $33,750 | $8,780 | $24,970 |
| 2020 | $1,723 | $33,750 | $8,780 | $24,970 |
| 2019 | $1,532 | $28,820 | $8,620 | $20,200 |
| 2018 | $1,537 | $28,820 | $8,620 | $20,200 |
| 2017 | $1,547 | $28,820 | $8,620 | $20,200 |
| 2016 | $1,596 | $27,710 | $8,290 | $19,420 |
| 2015 | $1,567 | $27,710 | $8,290 | $19,420 |
| 2014 | $1,567 | $27,710 | $8,290 | $19,420 |
| 2013 | $1,517 | $26,470 | $8,250 | $18,220 |
Source: Public Records
Map
Nearby Homes
- 419 Nold Ave
- 331 Derr Ave
- 223 E Larwill St
- 606 E Henry St
- 423 N Market St
- 534 N Buckeye St
- 134 E Bowman St Unit 1/2
- 227 N Walnut St
- 814 N Bever St
- 230 Clark Ave
- 920 Washington St
- 938 Washington St
- 140 Ohio St
- 1117 Quinby Ave
- 851 Park Blvd
- 5 E Melrose Unit 5
- 758 Western Dr
- 1575 Bellevue Dr
- 801 & 803 Colony Ct
- 1552 Renwood Dr
Your Personal Tour Guide
Ask me questions while you tour the home.