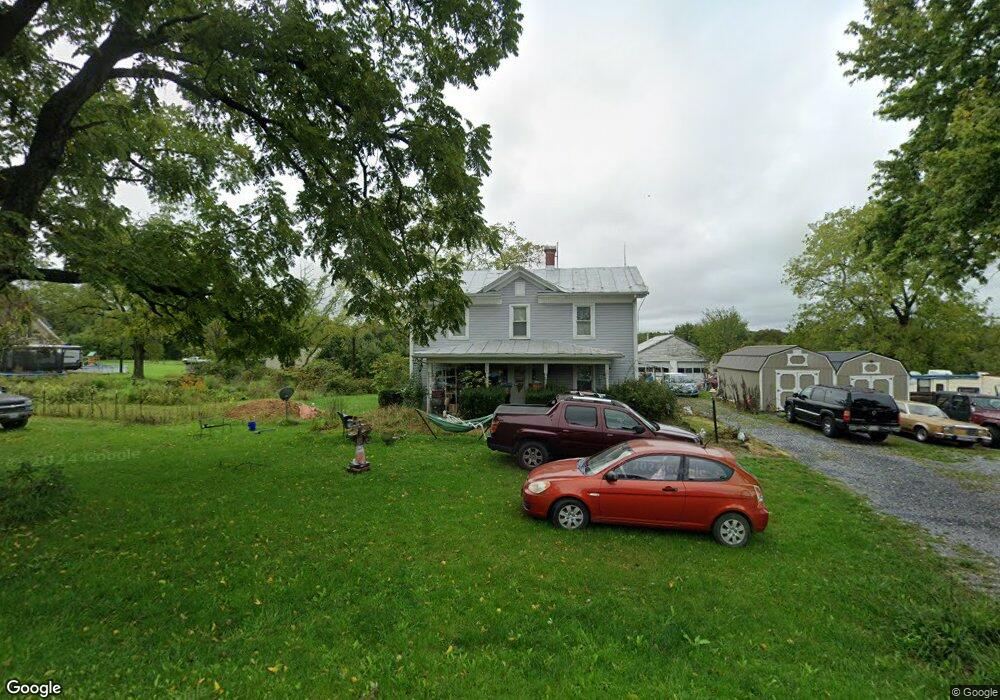
540 Horseshoe Cir Stuarts Draft, VA 24477
Estimated Value: $316,000 - $456,000
4
Beds
2
Baths
1,918
Sq Ft
$192/Sq Ft
Est. Value
About This Home
This home is located at 540 Horseshoe Cir, Stuarts Draft, VA 24477 and is currently estimated at $368,899, approximately $192 per square foot. 540 Horseshoe Cir is a home located in Augusta County with nearby schools including Guy K. Stump Elementary School, Stuarts Draft Middle School, and Stuarts Draft High School.
Ownership History
Date
Name
Owned For
Owner Type
Purchase Details
Closed on
Jul 14, 2017
Sold by
Secretary Of Housing Urban Development
Bought by
Huntley Paul E
Current Estimated Value
Home Financials for this Owner
Home Financials are based on the most recent Mortgage that was taken out on this home.
Original Mortgage
$140,295
Outstanding Balance
$116,625
Interest Rate
3.91%
Mortgage Type
New Conventional
Estimated Equity
$252,274
Purchase Details
Closed on
Feb 1, 2017
Sold by
Ocwen Loan Servicing Llc
Bought by
The Secretary Of Housing & Urban Develop
Purchase Details
Closed on
Jan 3, 2017
Sold by
Equity Trustees Llc A Virginia Limited L and Broce Douglas C
Bought by
Ocwen Loan Servicing Llc
Create a Home Valuation Report for This Property
The Home Valuation Report is an in-depth analysis detailing your home's value as well as a comparison with similar homes in the area
Purchase History
| Date | Buyer | Sale Price | Title Company |
|---|---|---|---|
| Huntley Paul E | -- | Court Square Title Agency | |
| The Secretary Of Housing & Urban Develop | $195,750 | Servicelink | |
| Ocwen Loan Servicing Llc | $135,300 | None Available |
Source: Public Records
Mortgage History
| Date | Status | Borrower | Loan Amount |
|---|---|---|---|
| Open | Huntley Paul E | $140,295 |
Source: Public Records
Tax History
| Year | Tax Paid | Tax Assessment Tax Assessment Total Assessment is a certain percentage of the fair market value that is determined by local assessors to be the total taxable value of land and additions on the property. | Land | Improvement |
|---|---|---|---|---|
| 2025 | $1,215 | $233,620 | $55,100 | $178,520 |
| 2024 | $1,215 | $233,620 | $55,100 | $178,520 |
| 2023 | $1,340 | $212,700 | $60,100 | $152,600 |
| 2022 | $1,340 | $212,700 | $60,100 | $152,600 |
| 2021 | $1,340 | $212,700 | $60,100 | $152,600 |
| 2020 | $1,340 | $212,700 | $60,100 | $152,600 |
| 2019 | $1,340 | $212,700 | $60,100 | $152,600 |
| 2018 | $1,233 | $195,721 | $60,100 | $135,621 |
| 2017 | $1,135 | $195,721 | $60,100 | $135,621 |
| 2016 | $1,135 | $195,721 | $60,100 | $135,621 |
| 2015 | $702 | $195,721 | $60,100 | $135,621 |
| 2014 | $702 | $195,721 | $60,100 | $135,621 |
| 2013 | $702 | $146,200 | $60,100 | $86,100 |
Source: Public Records
Map
Nearby Homes
- 253 Forest Springs Dr
- 12 Ceocia Ln
- 294 Forest Springs Dr
- 251 Cooper Dr
- 165 Cooper Dr
- 124 Forest Springs Dr
- 38 Shady Pond Ln
- 87 Falling Rock Dr
- 77 Greenway Rd
- TBD Howardsville Turnpike
- TBD Churchmans Mill Rd
- TBD Gerties Ln
- 0 Kiley Ln Unit 569156
- tbd Mill Creek Ln
- TBD Cold Springs Rd
- 241 Bowmans Run Dr
- 0 Johnson Dr Unit 663189
- 501 Howardsville Turnpike
- 38 Greenbriar Ln
- 153 Sylvan Dr
- 510 Horseshoe Cir
- 555 Horseshoe Cir
- 565 Horseshoe Cir
- 38 Meadow View Ln
- 49 Meadow View Ln
- 575 Horseshoe Cir
- 50 Meadow View Ln Unit 1
- 50 Meadow View Ln
- 597 Horseshoe Cir
- 59 Meadow View Ln
- 68 Fruit Tree Ln
- 60 Meadow View Ln
- 37 Winners Circle Ln
- 605 Horseshoe Cir
- 75 Meadow View Ln
- 78 Meadow View Ln
- 96 Fruit Tree Ln
- 620 Horseshoe Cir
- 400 Horseshoe Cir
- 449 Horseshoe Cir
Your Personal Tour Guide
Ask me questions while you tour the home.