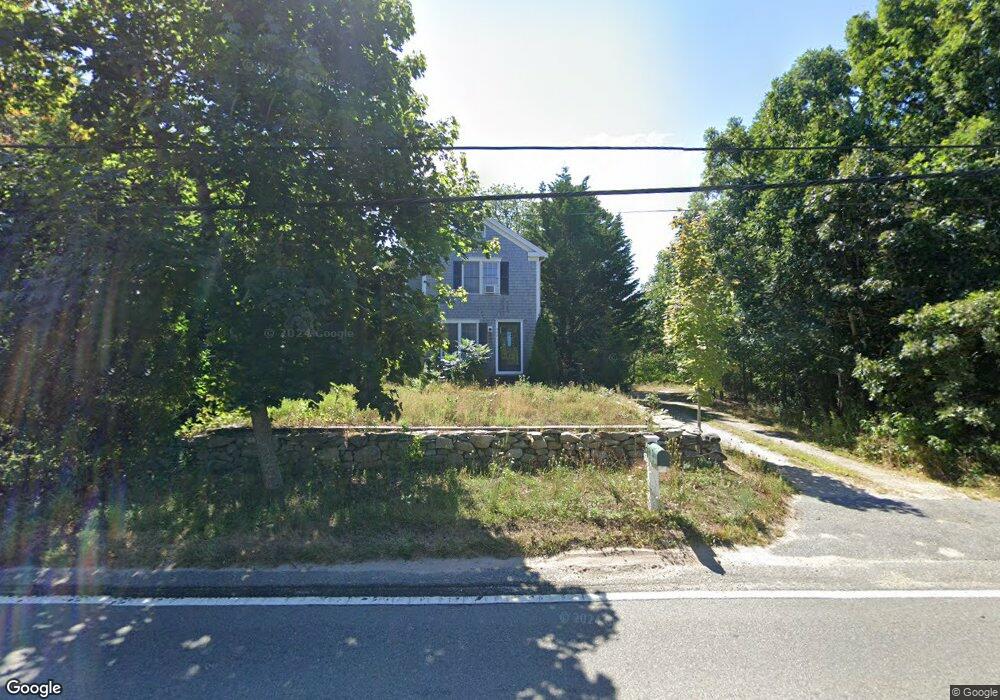
540 Main St Brewster, MA 02631
Estimated Value: $624,026 - $774,000
2
Beds
2
Baths
1,001
Sq Ft
$666/Sq Ft
Est. Value
About This Home
This home is located at 540 Main St, Brewster, MA 02631 and is currently estimated at $666,257, approximately $665 per square foot. 540 Main St is a home located in Barnstable County with nearby schools including Stony Brook Elementary School, Eddy Elementary School, and Nauset Regional Middle School.
Ownership History
Date
Name
Owned For
Owner Type
Purchase Details
Closed on
Oct 27, 2017
Sold by
Nickerson Thomas B
Bought by
Nickerson Bethany A and Nickerson Thomas B
Current Estimated Value
Purchase Details
Closed on
Oct 2, 2017
Sold by
Thomas B Nickerson T
Bought by
Nickerson Bethany A and Nickerson Thomas B
Create a Home Valuation Report for This Property
The Home Valuation Report is an in-depth analysis detailing your home's value as well as a comparison with similar homes in the area
Home Values in the Area
Average Home Value in this Area
Purchase History
| Date | Buyer | Sale Price | Title Company |
|---|---|---|---|
| Nickerson Bethany A | -- | -- | |
| Nickerson Bethany A | -- | -- |
Source: Public Records
Tax History
| Year | Tax Paid | Tax Assessment Tax Assessment Total Assessment is a certain percentage of the fair market value that is determined by local assessors to be the total taxable value of land and additions on the property. | Land | Improvement |
|---|---|---|---|---|
| 2025 | $3,471 | $504,500 | $218,400 | $286,100 |
| 2024 | $3,266 | $479,600 | $206,100 | $273,500 |
| 2023 | $2,997 | $428,800 | $183,900 | $244,900 |
| 2022 | $2,713 | $345,600 | $137,900 | $207,700 |
| 2021 | $2,587 | $301,500 | $119,900 | $181,600 |
| 2020 | $2,543 | $295,000 | $119,900 | $175,100 |
| 2019 | $2,439 | $284,300 | $115,300 | $169,000 |
| 2018 | $3,119 | $279,900 | $115,300 | $164,600 |
| 2017 | $2,230 | $265,800 | $115,300 | $150,500 |
| 2016 | $2,214 | $262,600 | $113,100 | $149,500 |
| 2015 | $2,136 | $258,600 | $110,800 | $147,800 |
Source: Public Records
Map
Nearby Homes
- 117 A p Newcomb Rd
- 0 Ridgewood Dr
- 80 Abby Rd
- 0 Canoe Pond Dr
- 98 Leland Rd
- 92 Whiffletree Ave
- 186 Canoe Pond Dr
- 34 Pleasant St Unit 3
- 102 Wildwood Rd
- 20 Spring Ln
- 53 Brier Ln
- 49 Monument View Rd
- 240 Robbins Hill Rd
- 309 Great Fields Rd
- 36 Island St
- 149 Greenland Cir
- 10 Shiverick Rd
- 37 Stony Way
- 40 Harbor Rd
- 1706 Route 6a Unit 18
Your Personal Tour Guide
Ask me questions while you tour the home.