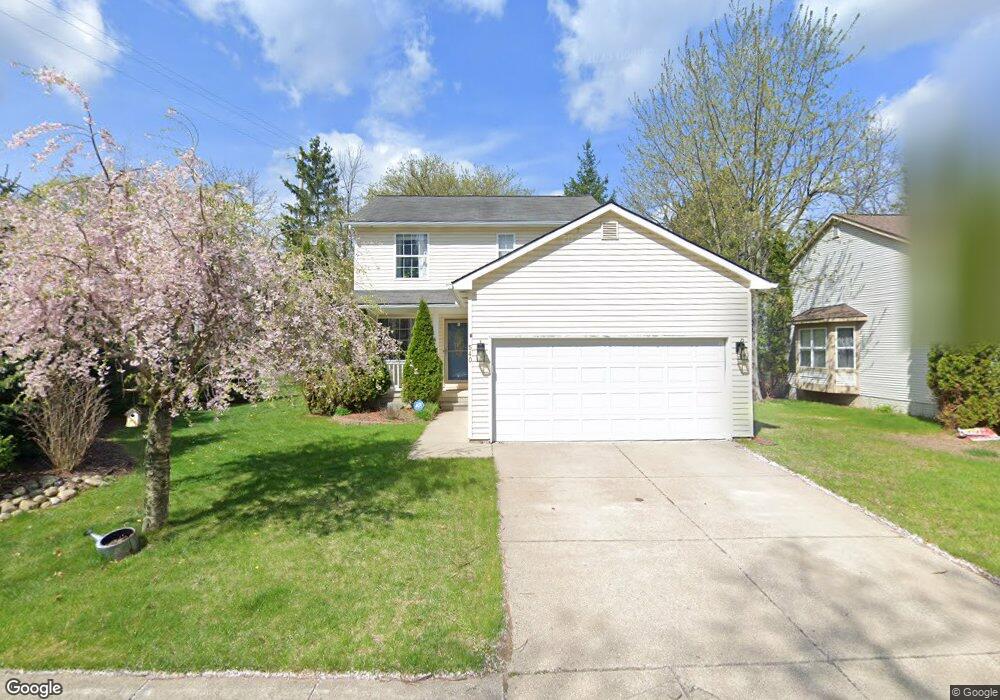
540 Mill Pond Dr Unit Bldg-Unit Fenton, MI 48430
Estimated Value: $308,000 - $320,000
3
Beds
2
Baths
1,332
Sq Ft
$236/Sq Ft
Est. Value
About This Home
This home is located at 540 Mill Pond Dr Unit Bldg-Unit, Fenton, MI 48430 and is currently estimated at $313,918, approximately $235 per square foot. 540 Mill Pond Dr Unit Bldg-Unit is a home located in Genesee County with nearby schools including Fenton Senior High School and St. John the Evangelist Catholic School.
Ownership History
Date
Name
Owned For
Owner Type
Purchase Details
Closed on
Jun 29, 2022
Sold by
Gooch Hunter R
Bought by
Schoonover Alexis
Current Estimated Value
Home Financials for this Owner
Home Financials are based on the most recent Mortgage that was taken out on this home.
Original Mortgage
$232,800
Outstanding Balance
$221,160
Interest Rate
5.09%
Mortgage Type
New Conventional
Estimated Equity
$92,758
Purchase Details
Closed on
Nov 30, 2021
Sold by
Pitz and Heather
Bought by
Gooch Hunter R and Schoonover Alexis
Home Financials for this Owner
Home Financials are based on the most recent Mortgage that was taken out on this home.
Original Mortgage
$227,950
Interest Rate
2.98%
Mortgage Type
New Conventional
Purchase Details
Closed on
Jul 10, 2018
Sold by
Geiger Nicolas J
Bought by
Pitz Paul and Pitz Heather
Purchase Details
Closed on
Aug 20, 2008
Sold by
Wells Fargo Bank National Association
Bought by
Geiger Nicolas J
Home Financials for this Owner
Home Financials are based on the most recent Mortgage that was taken out on this home.
Original Mortgage
$107,051
Interest Rate
5.44%
Mortgage Type
FHA
Purchase Details
Closed on
Jul 2, 2008
Sold by
Mortgage Electronic Registration Systems
Bought by
Wells Fargo Bank Na
Home Financials for this Owner
Home Financials are based on the most recent Mortgage that was taken out on this home.
Original Mortgage
$107,051
Interest Rate
5.44%
Mortgage Type
FHA
Purchase Details
Closed on
Mar 26, 2008
Sold by
Wolok Jeffrey
Bought by
Mortgage Electronic Registration Systems
Purchase Details
Closed on
Dec 28, 2005
Sold by
Aeschliman Joseph and Aeschliman Kathryn
Bought by
Wolok Jeffrey
Home Financials for this Owner
Home Financials are based on the most recent Mortgage that was taken out on this home.
Original Mortgage
$19,800
Interest Rate
6.34%
Mortgage Type
Stand Alone Second
Purchase Details
Closed on
Sep 8, 2000
Sold by
St Dennis Development Inc
Bought by
Aeschliman Joseph and Aeschliman Kathryn
Home Financials for this Owner
Home Financials are based on the most recent Mortgage that was taken out on this home.
Original Mortgage
$120,360
Interest Rate
9.4%
Purchase Details
Closed on
Oct 27, 1999
Sold by
Heritage Pond Ltd Partnership
Bought by
St Dennis Development Inc
Create a Home Valuation Report for This Property
The Home Valuation Report is an in-depth analysis detailing your home's value as well as a comparison with similar homes in the area
Home Values in the Area
Average Home Value in this Area
Purchase History
| Date | Buyer | Sale Price | Title Company |
|---|---|---|---|
| Schoonover Alexis | -- | None Listed On Document | |
| Gooch Hunter R | $235,000 | None Listed On Document | |
| Pitz Paul | $172,000 | Legacy Title Agency | |
| Geiger Nicolas J | $10,900 | Chicago Title Of Michigan | |
| Wells Fargo Bank Na | -- | E Title Agency | |
| Mortgage Electronic Registration Systems | $140,000 | None Available | |
| Wolok Jeffrey | $198,900 | Title Direct Llc | |
| Aeschliman Joseph | $20,000 | First American | |
| St Dennis Development Inc | $1,100,000 | Cislo Title Company |
Source: Public Records
Mortgage History
| Date | Status | Borrower | Loan Amount |
|---|---|---|---|
| Open | Schoonover Alexis | $232,800 | |
| Previous Owner | Gooch Hunter R | $227,950 | |
| Previous Owner | Geiger Nicolas J | $107,051 | |
| Previous Owner | Wolok Jeffrey | $19,800 | |
| Previous Owner | Aeschliman Joseph | $120,360 |
Source: Public Records
Tax History Compared to Growth
Tax History
| Year | Tax Paid | Tax Assessment Tax Assessment Total Assessment is a certain percentage of the fair market value that is determined by local assessors to be the total taxable value of land and additions on the property. | Land | Improvement |
|---|---|---|---|---|
| 2025 | $4,888 | $132,300 | $0 | $0 |
| 2024 | $5,309 | $122,900 | $0 | $0 |
| 2023 | $5,060 | $109,500 | $0 | $0 |
| 2022 | $6,242 | $97,800 | $0 | $0 |
| 2021 | $3,396 | $88,800 | $0 | $0 |
| 2020 | $2,232 | $87,300 | $0 | $0 |
| 2019 | $2,211 | $77,700 | $0 | $0 |
| 2018 | $2,430 | $74,700 | $0 | $0 |
| 2017 | $2,340 | $76,000 | $0 | $0 |
| 2016 | $2,324 | $69,900 | $0 | $0 |
| 2015 | $2,375 | $67,700 | $0 | $0 |
| 2012 | -- | $52,200 | $52,200 | $0 |
Source: Public Records
Map
Nearby Homes
- 304 S Lemen St
- 407 E Elizabeth St
- 700 Eagle Dr Unit 1
- 300 Union St
- 724 Eagle Dr Unit 11
- 1039 S East St
- 961 Loon Ct Unit 49
- 928 Eagle Dr Unit A119
- 928 Eagle Dr Unit A116
- 928 Eagle Dr Unit A117
- 928 Eagle Dr Unit A115
- 928 Eagle Dr Unit A118
- 928 Eagle Dr Unit A114
- 928 Eagle Dr Unit A113
- 928 Eagle Dr Unit A112
- 928 Eagle Dr Unit A110
- 928 Eagle Dr Unit A109
- 928 Eagle Dr Unit A108
- 928 Eagle Dr Unit A107
- 928 Eagle Dr Unit A106
- 540 Mill Pond Dr Unit 1
- 534 Mill Pond Dr Unit 2
- 530 Mill Pond Dr Unit 3
- 629 E South Holly Rd
- 524 Mill Pond Dr Unit 4
- 617 E South Holly Rd
- 624 E South Holly Rd
- 520 Mill Pond Dr
- 626 E South Holly Rd
- 514 Mill Pond Dr Unit 6
- 618 Heritage Cir Unit 9
- 1 Lone Oak Cir
- 620 Heritage Cir
- 616 Heritage Cir Unit 10
- 611 E South Holly Rd
- 510 Mill Pond Dr
- 641 Holly Point Unit 47
- 614 Heritage Cir Unit 11
- 515 Mill Pond Dr Unit 46
- 643 Holly Point Unit 48