Estimated Value: $91,000 - $169,000
2
Beds
1
Bath
1,176
Sq Ft
$109/Sq Ft
Est. Value
About This Home
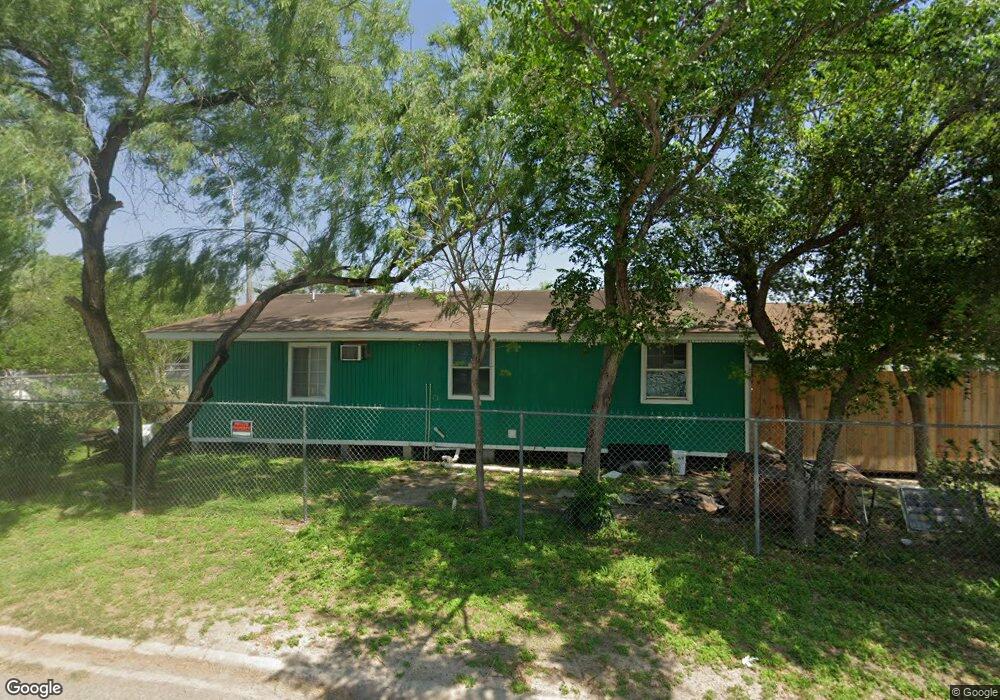
This home is located at 540 Pantera Dr, Alamo, TX 78516 and is currently estimated at $128,196, approximately $109 per square foot. 540 Pantera Dr is a home located in Hidalgo County with nearby schools including Marcia R. Garza Elementary, Jesus "Jesse" Vela Jr. Middle School, and PSJA Memorial Early College High School.
Create a Home Valuation Report for This Property
The Home Valuation Report is an in-depth analysis detailing your home's value as well as a comparison with similar homes in the area
Home Values in the Area
Average Home Value in this Area
Tax History Compared to Growth
Tax History
| Year | Tax Paid | Tax Assessment Tax Assessment Total Assessment is a certain percentage of the fair market value that is determined by local assessors to be the total taxable value of land and additions on the property. | Land | Improvement |
|---|---|---|---|---|
| 2025 | $1,802 | $128,374 | $41,131 | $87,243 |
| 2024 | $1,802 | $93,054 | $41,131 | $51,923 |
| 2023 | $1,824 | $94,254 | $41,131 | $53,123 |
| 2022 | $1,245 | $58,977 | $10,701 | $48,276 |
| 2021 | $1,093 | $50,528 | $10,701 | $39,827 |
| 2020 | $941 | $42,758 | $10,701 | $32,057 |
| 2019 | $962 | $41,722 | $10,701 | $31,021 |
| 2018 | $978 | $42,067 | $10,701 | $31,366 |
| 2017 | $1,003 | $42,758 | $10,701 | $32,057 |
| 2016 | $979 | $41,728 | $10,701 | $31,027 |
| 2015 | $1,076 | $42,058 | $10,701 | $31,357 |
Source: Public Records
Map
Nearby Homes
- 530 Jaguar Dr
- 1310 S 9th St
- 607 Tower Oak Dr
- 514 Tower Oak Dr
- 519 Tower Oak Dr
- 507 Tower Oak Dr
- 613 Tower Oak Dr
- 611 Tower Oak Dr
- 1315 Carlos Dr
- 1314 Carlos Dr
- 517 Tower Oak Dr
- 907 Loma Linda St
- 323 San Angelo Dr
- 1311 Carlos Dr
- 1309 Carlos Dr
- 1339 Middle St
- 324 San Vicente Dr
- 1315 Middle St
- 428 El Gato Rd
- 715 Pauli Ave