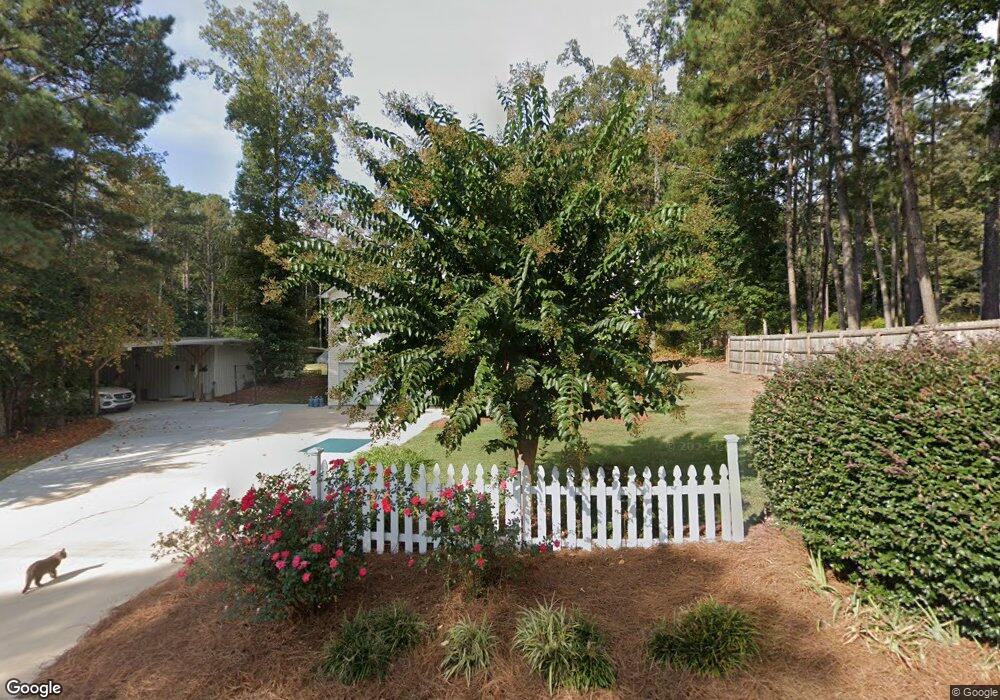
540 Preston Place Ct Carrollton, GA 30117
Estimated Value: $287,000 - $313,713
3
Beds
2
Baths
1,461
Sq Ft
$206/Sq Ft
Est. Value
About This Home
This home is located at 540 Preston Place Ct, Carrollton, GA 30117 and is currently estimated at $300,678, approximately $205 per square foot. 540 Preston Place Ct is a home located in Carroll County with nearby schools including Bowdon Elementary School, Bowdon Middle School, and Bowdon High School.
Ownership History
Date
Name
Owned For
Owner Type
Purchase Details
Closed on
Oct 22, 2020
Sold by
Turner Danny
Bought by
Turner Kendra
Current Estimated Value
Purchase Details
Closed on
Jul 30, 2008
Sold by
Buckner Jonathan C
Bought by
Turner Danny and Turner Kendra
Home Financials for this Owner
Home Financials are based on the most recent Mortgage that was taken out on this home.
Original Mortgage
$122,921
Interest Rate
6.31%
Mortgage Type
New Conventional
Purchase Details
Closed on
Sep 5, 2002
Sold by
Westside Homes Inc
Bought by
Buckner Jonathan C
Purchase Details
Closed on
Oct 26, 2001
Sold by
Chariot Homes Inc
Bought by
Westside Homes Inc
Purchase Details
Closed on
Oct 11, 2001
Sold by
Coleman Eugene W
Bought by
Chariot Homes Inc
Purchase Details
Closed on
Sep 5, 2001
Bought by
Coleman Eugene W
Create a Home Valuation Report for This Property
The Home Valuation Report is an in-depth analysis detailing your home's value as well as a comparison with similar homes in the area
Home Values in the Area
Average Home Value in this Area
Purchase History
| Date | Buyer | Sale Price | Title Company |
|---|---|---|---|
| Turner Kendra | -- | -- | |
| Turner Danny | $120,000 | -- | |
| Buckner Jonathan C | $110,200 | -- | |
| Westside Homes Inc | $20,500 | -- | |
| Chariot Homes Inc | $195,000 | -- | |
| Coleman Eugene W | -- | -- |
Source: Public Records
Mortgage History
| Date | Status | Borrower | Loan Amount |
|---|---|---|---|
| Previous Owner | Turner Danny | $122,921 |
Source: Public Records
Tax History Compared to Growth
Tax History
| Year | Tax Paid | Tax Assessment Tax Assessment Total Assessment is a certain percentage of the fair market value that is determined by local assessors to be the total taxable value of land and additions on the property. | Land | Improvement |
|---|---|---|---|---|
| 2024 | $2,166 | $114,897 | $10,500 | $104,397 |
| 2023 | $2,166 | $106,272 | $10,500 | $95,772 |
| 2022 | $1,731 | $81,013 | $12,000 | $69,013 |
| 2021 | $1,595 | $71,151 | $12,000 | $59,151 |
| 2020 | $1,470 | $64,104 | $12,000 | $52,104 |
| 2019 | $1,265 | $54,774 | $6,000 | $48,774 |
| 2018 | $1,125 | $49,386 | $6,000 | $43,386 |
| 2017 | $1,128 | $49,386 | $6,000 | $43,386 |
| 2016 | $999 | $54,087 | $6,664 | $47,423 |
| 2015 | $1,042 | $41,268 | $6,000 | $35,268 |
| 2014 | $1,047 | $41,268 | $6,000 | $35,268 |
Source: Public Records
Map
Nearby Homes
- 0 Preston Place Ct Unit 8161960
- 534 Preston Place Ct
- 543 Preston Place Ct
- 537 Preston Place Ct
- 552 Preston Place Ct
- 549 Preston Place Ct
- 525 Preston Place Ct
- 531 Preston Place Ct
- 519 Preston Place Ct
- 500 Preston Place Ct
- 561 Preston Place Ct
- 513 Preston Place Ct
- 566 Preston Place Ct
- 507 Preston Place Ct
- 564 Preston Place Ct
- 4538 W Highway 166
- 4504 W Highway 166
- 137 Red Oak Dr
- 150 Farmers High Rd
- 4628 W Highway 166