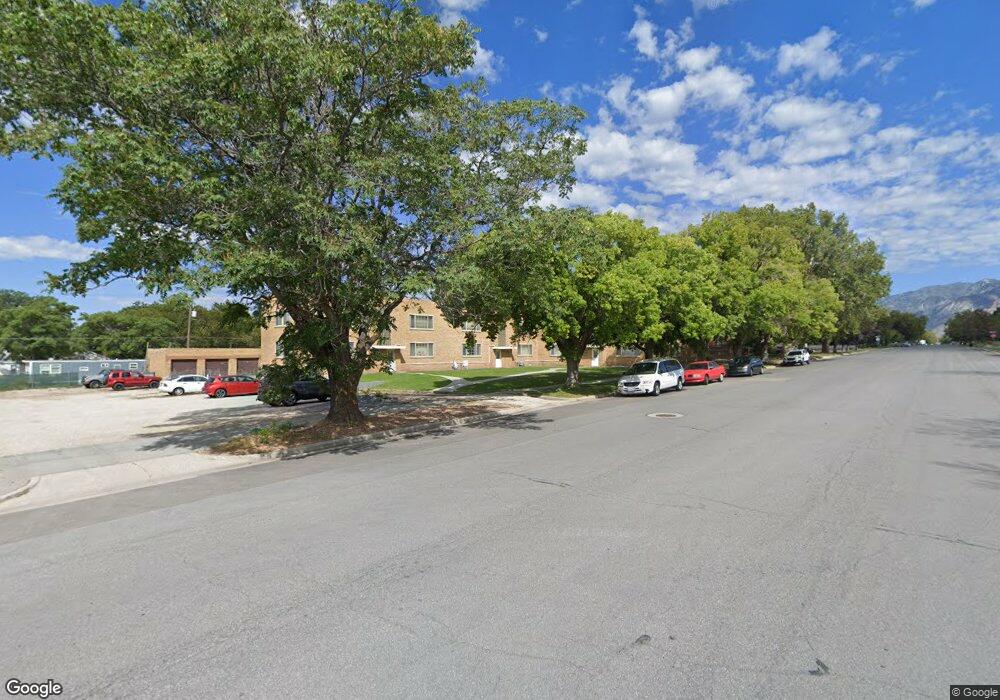
540 S 100 E Brigham City, UT 84302
Estimated Value: $476,000 - $614,000
Studio
--
Bath
960
Sq Ft
$566/Sq Ft
Est. Value
About This Home
This home is located at 540 S 100 E, Brigham City, UT 84302 and is currently estimated at $543,337, approximately $565 per square foot. 540 S 100 E is a home located in Box Elder County with nearby schools including Golden Spike Elementary, Adele C. Young Intermediate School, and Box Elder Middle School.
Ownership History
Date
Name
Owned For
Owner Type
Purchase Details
Closed on
Oct 10, 2025
Sold by
Guire Kelly and Guire Leah
Bought by
Maisey Gordon and Maisey Kelle
Current Estimated Value
Purchase Details
Closed on
Mar 30, 2018
Sold by
Ohman Jerald E
Bought by
Guire Kelly and Guire Leah
Home Financials for this Owner
Home Financials are based on the most recent Mortgage that was taken out on this home.
Original Mortgage
$180,000
Interest Rate
4.38%
Mortgage Type
Seller Take Back
Create a Home Valuation Report for This Property
The Home Valuation Report is an in-depth analysis detailing your home's value as well as a comparison with similar homes in the area
Purchase History
| Date | Buyer | Sale Price | Title Company |
|---|---|---|---|
| Maisey Gordon | -- | Phillips Hansen Land Title | |
| Guire Kelly | -- | Phillips Hansen Land Title C |
Source: Public Records
Mortgage History
| Date | Status | Borrower | Loan Amount |
|---|---|---|---|
| Previous Owner | Guire Kelly | $180,000 |
Source: Public Records
Tax History
| Year | Tax Paid | Tax Assessment Tax Assessment Total Assessment is a certain percentage of the fair market value that is determined by local assessors to be the total taxable value of land and additions on the property. | Land | Improvement |
|---|---|---|---|---|
| 2025 | $2,264 | $344,480 | $115,452 | $229,028 |
| 2024 | $2,057 | $346,502 | $110,452 | $236,050 |
| 2023 | $2,133 | $359,281 | $105,452 | $253,829 |
| 2022 | $1,875 | $292,180 | $92,347 | $199,833 |
| 2021 | $1,548 | $208,889 | $92,347 | $116,542 |
| 2020 | $1,439 | $208,889 | $92,347 | $116,542 |
| 2019 | $1,425 | $92,668 | $50,791 | $41,877 |
| 2018 | $1,369 | $117,709 | $50,791 | $66,918 |
| 2017 | $954 | $124,735 | $13,200 | $100,735 |
| 2016 | $1,010 | $76,023 | $13,200 | $62,823 |
| 2015 | $945 | $70,312 | $13,200 | $57,112 |
| 2014 | $945 | $68,506 | $13,200 | $55,306 |
| 2013 | -- | $68,506 | $13,200 | $55,306 |
Source: Public Records
Map
Nearby Homes
Your Personal Tour Guide
Ask me questions while you tour the home.