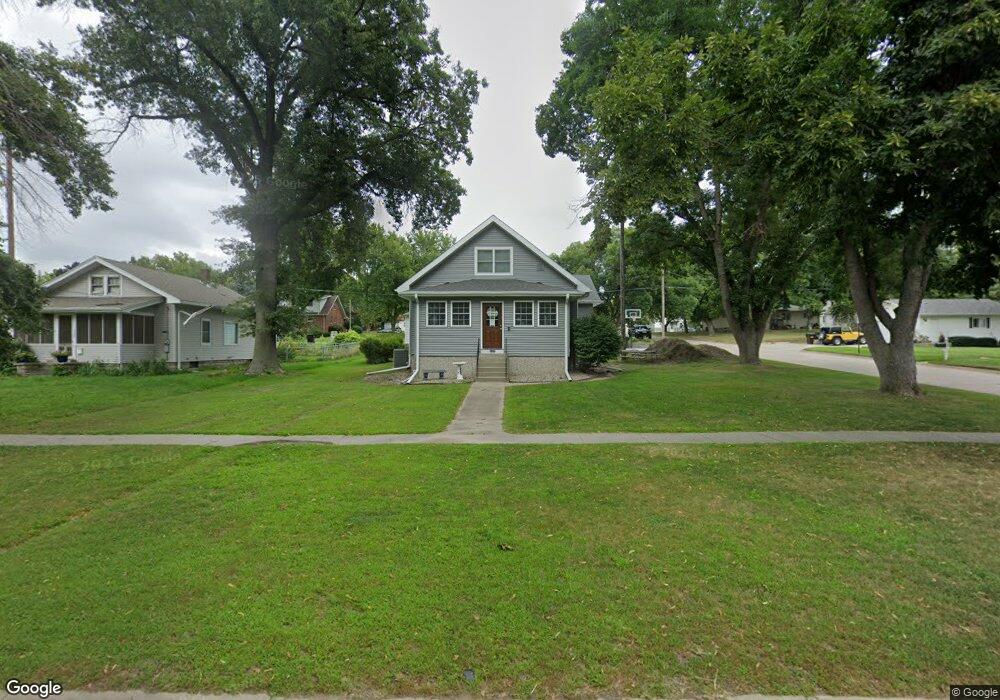
540 S Colfax St West Point, NE 68788
Estimated Value: $224,000 - $257,193
3
Beds
3
Baths
1,757
Sq Ft
$138/Sq Ft
Est. Value
About This Home
This home is located at 540 S Colfax St, West Point, NE 68788 and is currently estimated at $243,048, approximately $138 per square foot. 540 S Colfax St is a home located in Cuming County with nearby schools including West Point-Beemer Junior/Senior High School, St. Paul Lutheran School, and Guardian Angels Elementary School.
Ownership History
Date
Name
Owned For
Owner Type
Purchase Details
Closed on
Oct 13, 2011
Sold by
Schuetze Randy H and Schuetze Constance J
Bought by
Haase Melissa S
Current Estimated Value
Home Financials for this Owner
Home Financials are based on the most recent Mortgage that was taken out on this home.
Original Mortgage
$117,346
Outstanding Balance
$80,142
Interest Rate
4.28%
Mortgage Type
New Conventional
Estimated Equity
$162,906
Purchase Details
Closed on
Jun 30, 2006
Sold by
Hugo Kurt E and Hugo Lisamarie
Bought by
Schuetze Randy H and Schuetze Constance J
Home Financials for this Owner
Home Financials are based on the most recent Mortgage that was taken out on this home.
Original Mortgage
$110,500
Interest Rate
6.63%
Mortgage Type
New Conventional
Create a Home Valuation Report for This Property
The Home Valuation Report is an in-depth analysis detailing your home's value as well as a comparison with similar homes in the area
Home Values in the Area
Average Home Value in this Area
Purchase History
| Date | Buyer | Sale Price | Title Company |
|---|---|---|---|
| Haase Melissa S | $115,000 | -- | |
| Schuetze Randy H | $111,000 | -- |
Source: Public Records
Mortgage History
| Date | Status | Borrower | Loan Amount |
|---|---|---|---|
| Open | Haase Melissa S | $117,346 | |
| Previous Owner | Schuetze Randy H | $110,500 |
Source: Public Records
Tax History Compared to Growth
Tax History
| Year | Tax Paid | Tax Assessment Tax Assessment Total Assessment is a certain percentage of the fair market value that is determined by local assessors to be the total taxable value of land and additions on the property. | Land | Improvement |
|---|---|---|---|---|
| 2025 | $1,766 | $228,690 | $18,445 | $210,245 |
| 2024 | $1,766 | $208,705 | $18,445 | $190,260 |
| 2023 | $2,324 | $201,400 | $16,300 | $185,100 |
| 2022 | $2,261 | $178,750 | $12,870 | $165,880 |
| 2021 | $1,994 | $149,665 | $10,725 | $138,940 |
| 2020 | $1,663 | $124,540 | $10,725 | $113,815 |
| 2019 | $1,782 | $130,410 | $10,725 | $119,685 |
| 2018 | $1,649 | $120,155 | $10,725 | $109,430 |
| 2017 | $1,686 | $120,155 | $10,725 | $109,430 |
| 2016 | $1,672 | $115,780 | $10,725 | $105,055 |
| 2015 | $1,780 | $115,780 | $10,725 | $105,055 |
| 2014 | $1,872 | $106,760 | $10,725 | $96,035 |
| 2013 | $1,872 | $106,760 | $10,725 | $96,035 |
Source: Public Records
Map
Nearby Homes
- 528 S Colfax St
- 330 E Willow St
- 516 S Colfax St
- 606 S Colfax St
- 553 S Colfax St
- 529 S Colfax St
- 506 S Colfax St
- 543 S Niphon St
- Colfax S 506 St
- 521 S Colfax St
- 551 S Colfax St
- 624 S Colfax St
- 603 S Colfax St
- 329 E Sheridan St
- 513 S Colfax St
- 611 S Colfax St
- 628 S Colfax St
- 605 S Niphon St
- 507 S Niphon St
- 617 S Niphon St