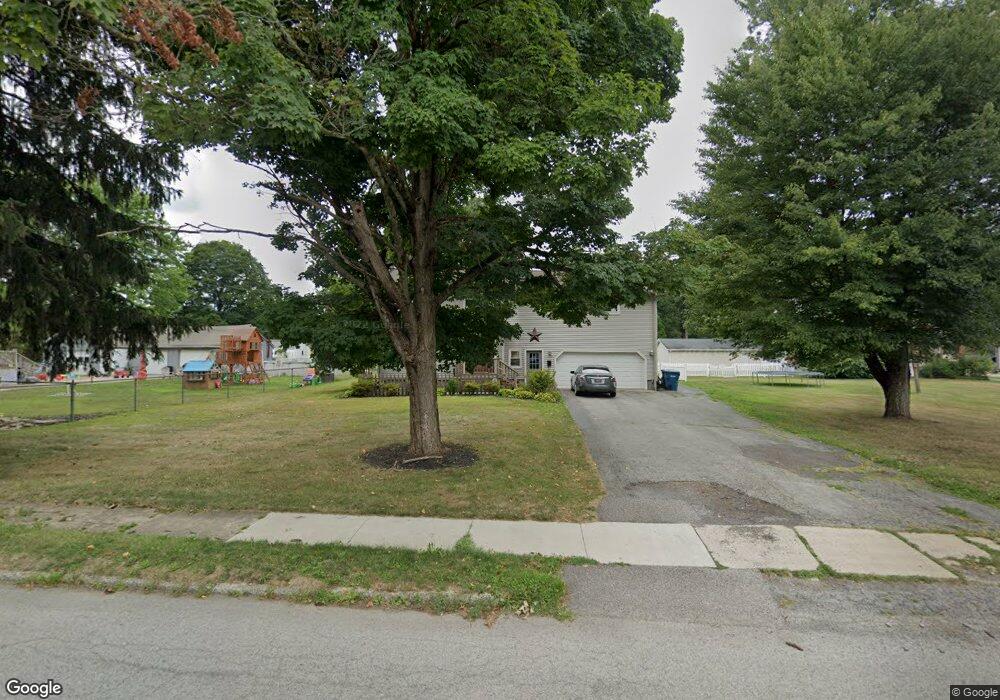
540 Stewart St Hubbard, OH 44425
Estimated Value: $136,000 - $272,000
4
Beds
1
Bath
2,342
Sq Ft
$91/Sq Ft
Est. Value
About This Home
This home is located at 540 Stewart St, Hubbard, OH 44425 and is currently estimated at $212,297, approximately $90 per square foot. 540 Stewart St is a home located in Trumbull County with nearby schools including Hubbard Elementary School, Hubbard Middle School, and Hubbard High School.
Ownership History
Date
Name
Owned For
Owner Type
Purchase Details
Closed on
Oct 29, 2021
Sold by
Baxter Scott A and Baxter Nicole M
Bought by
Baxter Scott A
Current Estimated Value
Home Financials for this Owner
Home Financials are based on the most recent Mortgage that was taken out on this home.
Original Mortgage
$144,143
Outstanding Balance
$133,000
Interest Rate
2.88%
Mortgage Type
New Conventional
Estimated Equity
$80,229
Purchase Details
Closed on
Jun 19, 2018
Sold by
Chaney Kimberly A
Bought by
Baxter Scoff A and Baxter Nicole M
Home Financials for this Owner
Home Financials are based on the most recent Mortgage that was taken out on this home.
Original Mortgage
$135,800
Interest Rate
4.6%
Mortgage Type
New Conventional
Purchase Details
Closed on
Apr 29, 2003
Sold by
Sargent Teri L
Bought by
Federal National Mortgage Association
Purchase Details
Closed on
Jan 1, 1990
Bought by
Daniel L Sargent
Create a Home Valuation Report for This Property
The Home Valuation Report is an in-depth analysis detailing your home's value as well as a comparison with similar homes in the area
Home Values in the Area
Average Home Value in this Area
Purchase History
| Date | Buyer | Sale Price | Title Company |
|---|---|---|---|
| Baxter Scott A | -- | Amrock Inc | |
| Baxter Scoff A | $140,000 | None Available | |
| Federal National Mortgage Association | $70,000 | -- | |
| Daniel L Sargent | -- | -- |
Source: Public Records
Mortgage History
| Date | Status | Borrower | Loan Amount |
|---|---|---|---|
| Open | Baxter Scott A | $144,143 | |
| Closed | Baxter Scoff A | $135,800 | |
| Closed | Chaney James A | $60,676 | |
| Closed | Chaney James A | $62,000 | |
| Closed | Chaney Kimberly A | $25,000 |
Source: Public Records
Tax History Compared to Growth
Tax History
| Year | Tax Paid | Tax Assessment Tax Assessment Total Assessment is a certain percentage of the fair market value that is determined by local assessors to be the total taxable value of land and additions on the property. | Land | Improvement |
|---|---|---|---|---|
| 2024 | $2,942 | $58,840 | $4,830 | $54,010 |
| 2023 | $2,942 | $58,840 | $4,830 | $54,010 |
| 2022 | $1,931 | $35,180 | $4,410 | $30,770 |
| 2021 | $1,940 | $35,180 | $4,410 | $30,770 |
| 2020 | $1,949 | $35,180 | $4,410 | $30,770 |
| 2019 | $1,887 | $32,620 | $4,410 | $28,210 |
| 2018 | $1,834 | $32,620 | $4,410 | $28,210 |
| 2017 | $1,829 | $32,620 | $4,410 | $28,210 |
| 2016 | $1,601 | $30,350 | $4,410 | $25,940 |
| 2015 | $1,607 | $30,350 | $4,410 | $25,940 |
| 2014 | $1,570 | $30,350 | $4,410 | $25,940 |
| 2013 | $1,567 | $30,350 | $4,410 | $25,940 |
Source: Public Records
Map
Nearby Homes