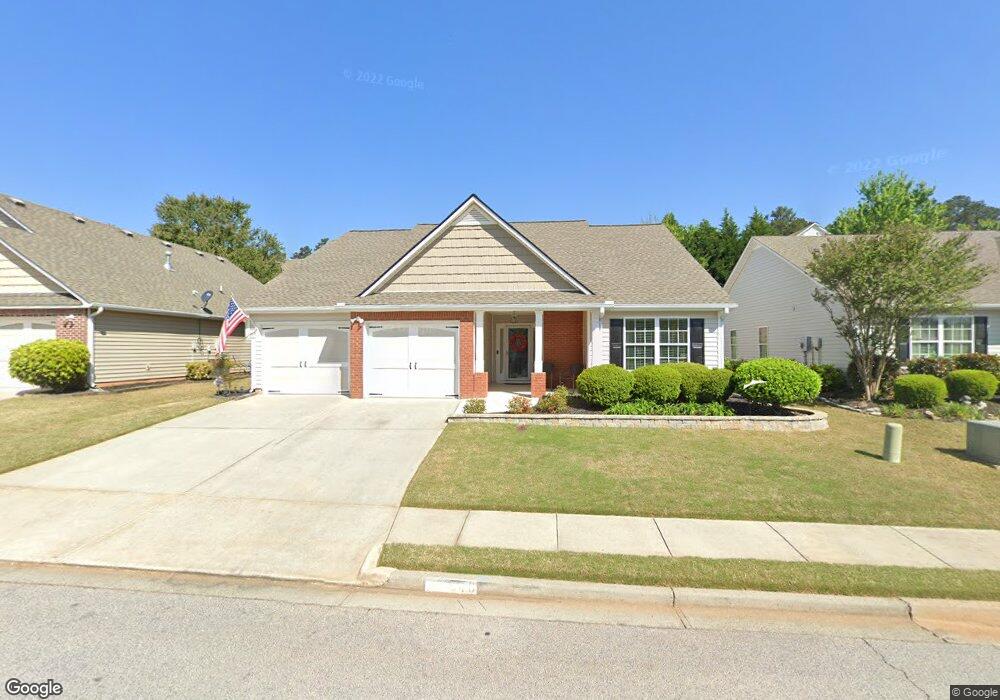
540 Triumph Way Unit 143 Winder, GA 30680
Estimated Value: $359,000 - $379,000
3
Beds
2
Baths
1,763
Sq Ft
$208/Sq Ft
Est. Value
About This Home
This home is located at 540 Triumph Way Unit 143, Winder, GA 30680 and is currently estimated at $367,039, approximately $208 per square foot. 540 Triumph Way Unit 143 is a home located in Barrow County with nearby schools including Holsenbeck Elementary School, Bear Creek Middle School, and Winder-Barrow High School.
Ownership History
Date
Name
Owned For
Owner Type
Purchase Details
Closed on
Jul 31, 2019
Sold by
Jordan Annette M
Bought by
Bagwell Ronnie and Bagwell Merry
Current Estimated Value
Purchase Details
Closed on
Sep 23, 2013
Sold by
Shoup Essie O
Bought by
Jordan Annette M
Home Financials for this Owner
Home Financials are based on the most recent Mortgage that was taken out on this home.
Original Mortgage
$117,857
Interest Rate
4.57%
Mortgage Type
New Conventional
Purchase Details
Closed on
Jul 20, 2007
Sold by
Meridian Homes Of Villas At Wi
Bought by
Shoup Essie O
Purchase Details
Closed on
Oct 21, 2004
Sold by
Diversified Development Co I
Bought by
Meridian Homes Of Villas At Winder Llc
Purchase Details
Closed on
Feb 6, 2003
Bought by
Diversified Development Co Inc
Create a Home Valuation Report for This Property
The Home Valuation Report is an in-depth analysis detailing your home's value as well as a comparison with similar homes in the area
Home Values in the Area
Average Home Value in this Area
Purchase History
| Date | Buyer | Sale Price | Title Company |
|---|---|---|---|
| Bagwell Ronnie | $225,000 | -- | |
| Jordan Annette M | $115,500 | -- | |
| Shoup Essie O | $161,800 | -- | |
| Meridian Homes Of Villas At Winder Llc | $30,500 | -- | |
| Diversified Development Co Inc | -- | -- |
Source: Public Records
Mortgage History
| Date | Status | Borrower | Loan Amount |
|---|---|---|---|
| Previous Owner | Jordan Annette M | $117,857 |
Source: Public Records
Tax History Compared to Growth
Tax History
| Year | Tax Paid | Tax Assessment Tax Assessment Total Assessment is a certain percentage of the fair market value that is determined by local assessors to be the total taxable value of land and additions on the property. | Land | Improvement |
|---|---|---|---|---|
| 2024 | $2,425 | $135,410 | $26,800 | $108,610 |
| 2023 | $1,390 | $135,410 | $26,800 | $108,610 |
| 2022 | $1,656 | $97,216 | $20,400 | $76,816 |
| 2021 | $1,384 | $89,227 | $17,200 | $72,027 |
| 2020 | $2,837 | $87,227 | $15,200 | $72,027 |
| 2019 | $1,050 | $79,106 | $15,200 | $63,906 |
| 2018 | $971 | $74,712 | $15,200 | $59,512 |
| 2017 | $1,945 | $65,179 | $15,200 | $49,979 |
| 2016 | $653 | $57,348 | $13,200 | $44,148 |
| 2015 | $659 | $57,826 | $13,200 | $44,626 |
| 2014 | $1,587 | $51,572 | $6,468 | $45,104 |
| 2013 | -- | $48,665 | $6,468 | $42,197 |
Source: Public Records
Map
Nearby Homes
- 540 Triumph Way
- 542 Triumph Way Unit 1
- 538 Triumph Way
- 621 Majesty Crossing
- 621 Majesty Crossing Unit 1
- 623 Majesty Crossing
- 544 Triumph Way
- 536 Triumph Way
- 619 Majesty Crossing
- 625 Majesty Crossing
- 539 Triumph Way
- 617 Majesty Crossing
- 617 Majesty Crossing Unit 80
- 534 Triumph Way
- 627 Majesty Crossing
- 541 Triumph Way
- 546 Triumph Way
- 535 Triumph Way
- 615 Majesty Crossing
- 543 Triumph Way