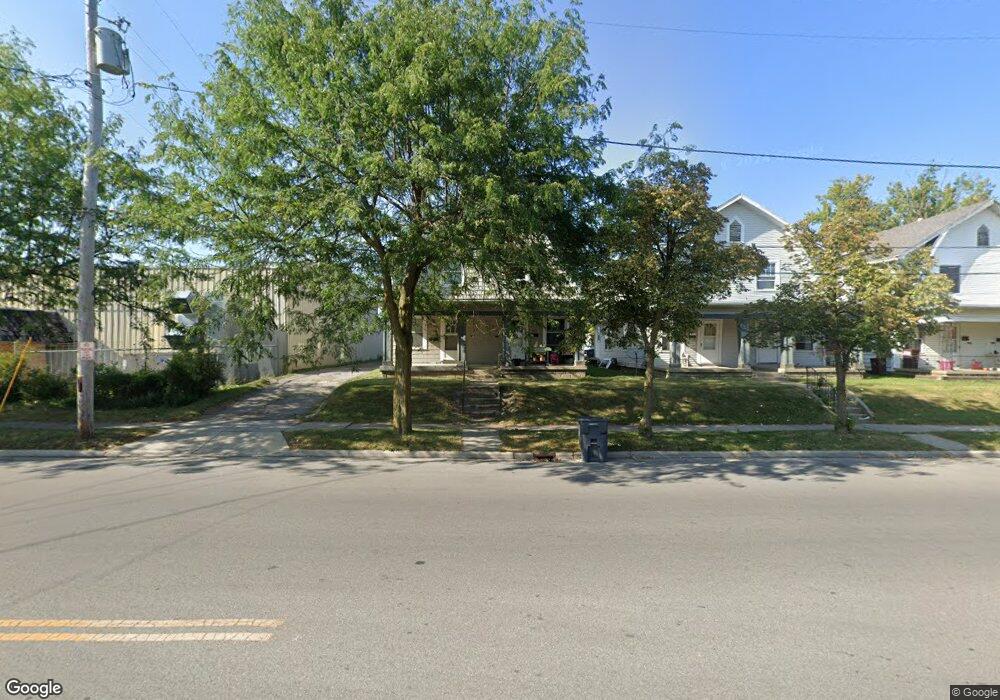
540 W Elm St Lima, OH 45801
Riverside North NeighborhoodEstimated Value: $71,530 - $117,000
4
Beds
2
Baths
2,352
Sq Ft
$41/Sq Ft
Est. Value
About This Home
This home is located at 540 W Elm St, Lima, OH 45801 and is currently estimated at $95,633, approximately $40 per square foot. 540 W Elm St is a home located in Allen County with nearby schools including Heritage Elementary School, Lima North Middle School, and Lima West Middle School.
Ownership History
Date
Name
Owned For
Owner Type
Purchase Details
Closed on
Oct 28, 2008
Sold by
Campbell Chad A
Bought by
King James C
Current Estimated Value
Purchase Details
Closed on
Jun 24, 2008
Sold by
Us Bank Na
Bought by
Campbell Chad A
Purchase Details
Closed on
Mar 25, 2008
Sold by
Caruso Thomas A and Caruso Nancy L
Bought by
Us Bank Na and Mastr Asset Backed Securities Trust 2006
Purchase Details
Closed on
Mar 22, 2006
Sold by
Caruso Thomas A and Caruso Nancy L
Bought by
Princess Buttercup Llc
Purchase Details
Closed on
Nov 4, 2005
Sold by
Silye Dennis L and Silye Carolyn A
Bought by
Caruso Thomas A and Caruso Nancy L
Home Financials for this Owner
Home Financials are based on the most recent Mortgage that was taken out on this home.
Original Mortgage
$55,800
Interest Rate
9.37%
Mortgage Type
Adjustable Rate Mortgage/ARM
Purchase Details
Closed on
Mar 27, 1991
Bought by
Silye Dennis L
Create a Home Valuation Report for This Property
The Home Valuation Report is an in-depth analysis detailing your home's value as well as a comparison with similar homes in the area
Home Values in the Area
Average Home Value in this Area
Purchase History
| Date | Buyer | Sale Price | Title Company |
|---|---|---|---|
| King James C | $7,000 | Attorney | |
| Campbell Chad A | $3,000 | Accutitle Agency Inc | |
| Us Bank Na | $12,000 | None Available | |
| Princess Buttercup Llc | -- | None Available | |
| Caruso Thomas A | $62,000 | None Available | |
| Caruso Thomas A | $29,700 | None Available | |
| Silye Dennis L | $40,000 | -- |
Source: Public Records
Mortgage History
| Date | Status | Borrower | Loan Amount |
|---|---|---|---|
| Previous Owner | Caruso Thomas A | $55,800 |
Source: Public Records
Tax History
| Year | Tax Paid | Tax Assessment Tax Assessment Total Assessment is a certain percentage of the fair market value that is determined by local assessors to be the total taxable value of land and additions on the property. | Land | Improvement |
|---|---|---|---|---|
| 2024 | $597 | $15,120 | $2,590 | $12,530 |
| 2023 | $643 | $14,390 | $2,450 | $11,940 |
| 2022 | $645 | $14,390 | $2,450 | $11,940 |
| 2021 | $683 | $14,390 | $2,450 | $11,940 |
| 2020 | $736 | $13,860 | $1,750 | $12,110 |
| 2019 | $736 | $13,860 | $1,750 | $12,110 |
| 2018 | $733 | $13,860 | $1,750 | $12,110 |
| 2017 | $739 | $13,860 | $1,750 | $12,110 |
| 2016 | $749 | $13,860 | $1,750 | $12,110 |
| 2015 | $818 | $13,860 | $1,750 | $12,110 |
| 2014 | $818 | $15,020 | $1,820 | $13,200 |
| 2013 | $797 | $15,020 | $1,820 | $13,200 |
Source: Public Records
Map
Nearby Homes
- 325 Nye St
- 417 S McDonel St
- 846 Faurot Ave
- 852 Faurot Ave
- 210 S Baxter St
- 705 W Elm St
- 932 Faurot Ave
- 426 S Baxter St
- 419 S Atlantic Ave
- 411 S Collett St
- 325 N McDonel St
- 627 Brice Ave
- 431 N Metcalf St
- 735 Brice Ave
- 753 Brice Ave
- 745 Richie Ave
- 5 Unit Package
- 712 S Elizabeth St
- 508 N Collett St
- 431 S Jameson Ave
- 536 W Elm St
- 532 W Elm St
- 524 W Elm St
- 520 W Elm St
- 535 W Spring St
- 555 W Elm St
- 28 Rental Package
- 563 W Spring St
- 316 Elmwood Place
- 500 W Elm St
- 563 W Elm St
- 515 W Spring St
- 569 W Spring St
- 222 S McDonel
- 567 W Elm St
- 218 S McDonel St
- 320 Elmwood Place
- 4 House Package
- 212 S McDonel St
- 228 S Metcalf St
Your Personal Tour Guide
Ask me questions while you tour the home.