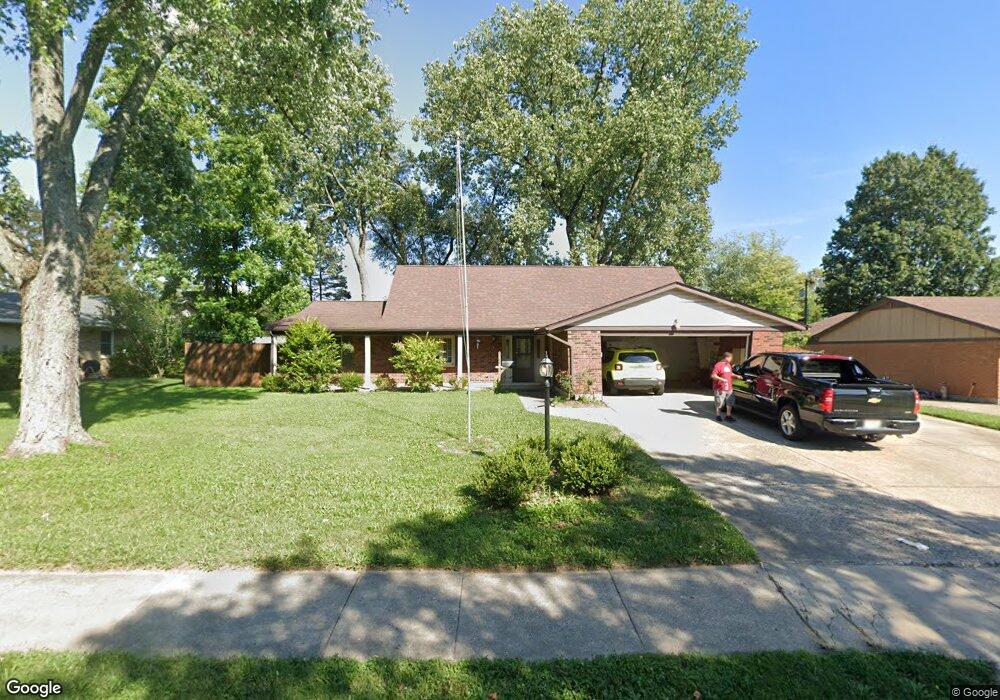
5400 Bigger Rd Unit KETTERING Dayton, OH 45440
Estimated Value: $333,058 - $361,000
4
Beds
2
Baths
2,458
Sq Ft
$143/Sq Ft
Est. Value
About This Home
This home is located at 5400 Bigger Rd Unit KETTERING, Dayton, OH 45440 and is currently estimated at $351,765, approximately $143 per square foot. 5400 Bigger Rd Unit KETTERING is a home located in Montgomery County with nearby schools including John F. Kennedy Elementary School, Kettering Middle School, and Kettering Fairmont High School.
Ownership History
Date
Name
Owned For
Owner Type
Purchase Details
Closed on
Aug 13, 2010
Sold by
Big House Properties Llc
Bought by
Weeks Rudolph and Weeks Hailita
Current Estimated Value
Home Financials for this Owner
Home Financials are based on the most recent Mortgage that was taken out on this home.
Original Mortgage
$130,950
Interest Rate
8%
Mortgage Type
Seller Take Back
Purchase Details
Closed on
Dec 24, 2007
Sold by
Martinek Edward F and Martinek Ann M
Bought by
Big House Properties Llc
Purchase Details
Closed on
Dec 13, 2002
Sold by
Keirn Gary D and Keirn Shirley P
Bought by
Martinek Edward F and Martinek Ann M
Home Financials for this Owner
Home Financials are based on the most recent Mortgage that was taken out on this home.
Original Mortgage
$124,320
Interest Rate
6.01%
Mortgage Type
Purchase Money Mortgage
Create a Home Valuation Report for This Property
The Home Valuation Report is an in-depth analysis detailing your home's value as well as a comparison with similar homes in the area
Home Values in the Area
Average Home Value in this Area
Purchase History
| Date | Buyer | Sale Price | Title Company |
|---|---|---|---|
| Weeks Rudolph | $135,000 | None Available | |
| Big House Properties Llc | -- | Attorney | |
| Martinek Edward F | $155,400 | -- |
Source: Public Records
Mortgage History
| Date | Status | Borrower | Loan Amount |
|---|---|---|---|
| Closed | Weeks Rudolph | $130,950 | |
| Previous Owner | Martinek Edward F | $124,320 |
Source: Public Records
Tax History Compared to Growth
Tax History
| Year | Tax Paid | Tax Assessment Tax Assessment Total Assessment is a certain percentage of the fair market value that is determined by local assessors to be the total taxable value of land and additions on the property. | Land | Improvement |
|---|---|---|---|---|
| 2024 | $5,365 | $84,580 | $16,940 | $67,640 |
| 2023 | $5,365 | $84,580 | $16,940 | $67,640 |
| 2022 | $5,224 | $65,150 | $13,030 | $52,120 |
| 2021 | $4,840 | $65,150 | $13,030 | $52,120 |
| 2020 | $4,854 | $65,150 | $13,030 | $52,120 |
| 2019 | $4,896 | $58,120 | $13,030 | $45,090 |
| 2018 | $4,923 | $58,120 | $13,030 | $45,090 |
| 2017 | $4,545 | $58,120 | $13,030 | $45,090 |
| 2016 | $4,321 | $51,900 | $13,030 | $38,870 |
| 2015 | $4,134 | $51,900 | $13,030 | $38,870 |
| 2014 | $4,134 | $51,900 | $13,030 | $38,870 |
| 2012 | -- | $47,410 | $12,920 | $34,490 |
Source: Public Records
Map
Nearby Homes
- 2236 E Whipp Rd
- 5335 Glendon Ln
- 2225 Coach Dr Unit L
- 2318 E Rahn Rd
- 5660 Coach Dr W Unit C
- 5267 Newell Cir
- 5274 Millcreek Rd
- 5195 Bigger Rd
- 2360 E Rahn Rd
- 5685 Coach Dr E Unit D
- 5695 Coach Dr E Unit E
- 5710 Coach Dr W Unit E
- 2184 Broadbent Way
- 2169 Broadbent Way
- 2132 Hewitt Ave Unit 12132
- 6046 N Quinella Way Unit 51246
- 6063 Hackamore Trail Unit 18
- 6067 Hackamore Trail Unit 20
- 2278 Millwood Rd
- 1457 Carriage Trace Blvd Unit 4
- 5400 Bigger Rd
- 5386 Bigger Rd
- 5412 Bigger Rd
- 5401 Oakvista Place
- 5387 Oakvista Place
- 5413 Oakvista Place
- 5374 Bigger Rd
- 5397 Bigger Rd
- 5375 Oakvista Place
- 5411 Bigger Rd
- 5385 Bigger Rd
- 5362 Bigger Rd
- 5373 Bigger Rd
- 5400 Oakvista Place
- 5363 Oakvista Place
- 2231 Berrycreek Dr
- 5350 Bigger Rd
- 5361 Bigger Rd
- 5418 Newell Dr
- 2231 E Whipp Rd