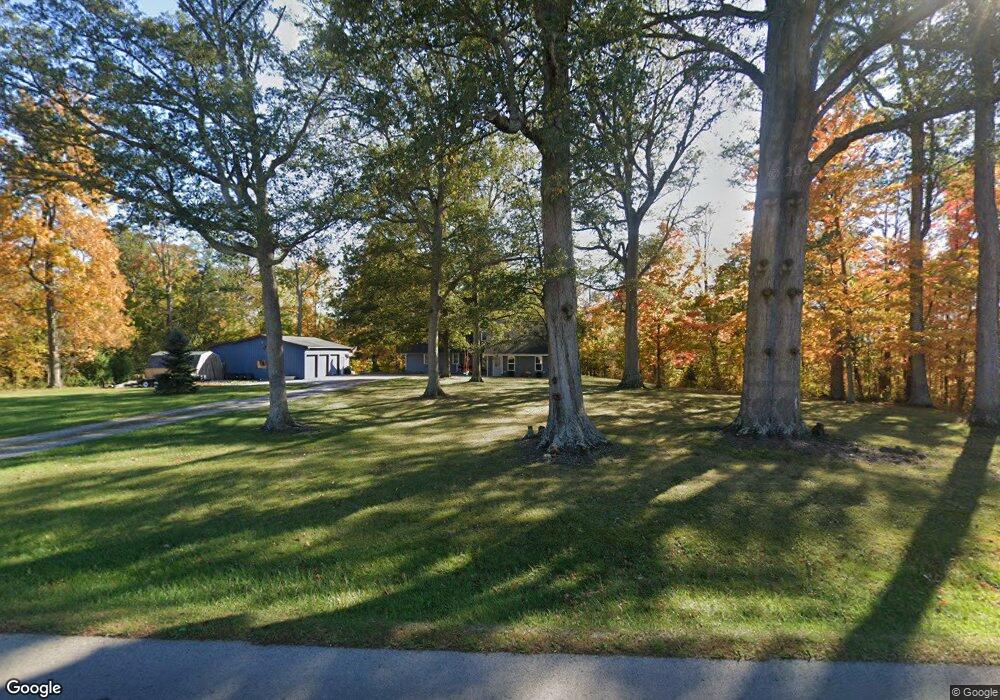
5400 Cardo Rd Fort Loramie, OH 45845
Estimated Value: $384,000 - $487,000
3
Beds
5
Baths
1,674
Sq Ft
$259/Sq Ft
Est. Value
About This Home
This home is located at 5400 Cardo Rd, Fort Loramie, OH 45845 and is currently estimated at $433,351, approximately $258 per square foot. 5400 Cardo Rd is a home located in Shelby County with nearby schools including Hardin Houston Elementary School and Houston High School.
Ownership History
Date
Name
Owned For
Owner Type
Purchase Details
Closed on
Sep 17, 2024
Sold by
Paulus Kirby L and Paulus Jill R
Bought by
Paulus Kirby L and Paulus Jill R
Current Estimated Value
Purchase Details
Closed on
Oct 7, 2011
Sold by
Jpmorgan Chase Bank National Association
Bought by
Paulus Kirby L and Paulus Jill R
Purchase Details
Closed on
Jun 8, 2011
Sold by
Jpmorgan Chase Bank National Association
Bought by
Paulus Kirby L and Paulus Jill R
Home Financials for this Owner
Home Financials are based on the most recent Mortgage that was taken out on this home.
Original Mortgage
$111,807
Interest Rate
4.62%
Mortgage Type
FHA
Purchase Details
Closed on
Jan 20, 2011
Sold by
Douglas Jimmie and Douglas Rebecca A
Bought by
Jpmorga Chase Bank National Association and Washington Mutual Bank
Purchase Details
Closed on
Jul 5, 1994
Sold by
Vanderhorst Dean L
Bought by
Sanford Derwin C
Create a Home Valuation Report for This Property
The Home Valuation Report is an in-depth analysis detailing your home's value as well as a comparison with similar homes in the area
Home Values in the Area
Average Home Value in this Area
Purchase History
| Date | Buyer | Sale Price | Title Company |
|---|---|---|---|
| Paulus Kirby L | -- | None Listed On Document | |
| Paulus Kirby L | -- | None Listed On Document | |
| Paulus Kirby L | -- | Accutitle Agency Inc | |
| Paulus Kirby L | $123,000 | Accu Title Agency Inc | |
| Jpmorga Chase Bank National Association | $127,500 | None Available | |
| Sanford Derwin C | $200,000 | -- |
Source: Public Records
Mortgage History
| Date | Status | Borrower | Loan Amount |
|---|---|---|---|
| Previous Owner | Paulus Kirby L | $111,807 |
Source: Public Records
Tax History Compared to Growth
Tax History
| Year | Tax Paid | Tax Assessment Tax Assessment Total Assessment is a certain percentage of the fair market value that is determined by local assessors to be the total taxable value of land and additions on the property. | Land | Improvement |
|---|---|---|---|---|
| 2024 | $2,917 | $86,110 | $13,410 | $72,700 |
| 2023 | $2,917 | $86,110 | $13,410 | $72,700 |
| 2022 | $2,463 | $66,730 | $10,860 | $55,870 |
| 2021 | $2,488 | $66,730 | $10,860 | $55,870 |
| 2020 | $2,488 | $66,730 | $10,860 | $55,870 |
| 2019 | $2,223 | $59,450 | $8,920 | $50,530 |
| 2018 | $2,168 | $59,450 | $8,920 | $50,530 |
| 2017 | $2,176 | $59,450 | $8,920 | $50,530 |
| 2016 | $2,032 | $56,750 | $7,320 | $49,430 |
| 2015 | $2,013 | $56,750 | $7,320 | $49,430 |
| 2014 | $2,013 | $56,750 | $7,320 | $49,430 |
| 2013 | $2,231 | $58,860 | $7,320 | $51,540 |
Source: Public Records
Map
Nearby Homes
- 6388 Stoker Rd
- 8381 Ohio 66
- 11519 Eilerman Rd
- 5025 Walzer Rd
- 12244 Short Dr Unit Condo Unit 10
- 9900 Greenville Rd
- 12600 E Shelby Rd
- 11968 Arling Rd
- Russia-Versailles Rd
- 2165 Stillwater Rd
- 10944 W Russell Rd
- 3848 Beulah Dr
- 193 N Paris St
- 47 N Frankfort St
- 3538 N Kuther Rd
- 0 Stonegate Dr Unit 21 10544857
- 0 Stonegate Dr Unit 14 10544847
- 3455 W Millcreek Rd
- 36 Shania Place Unit 23
- 27 Shania Place Unit 26