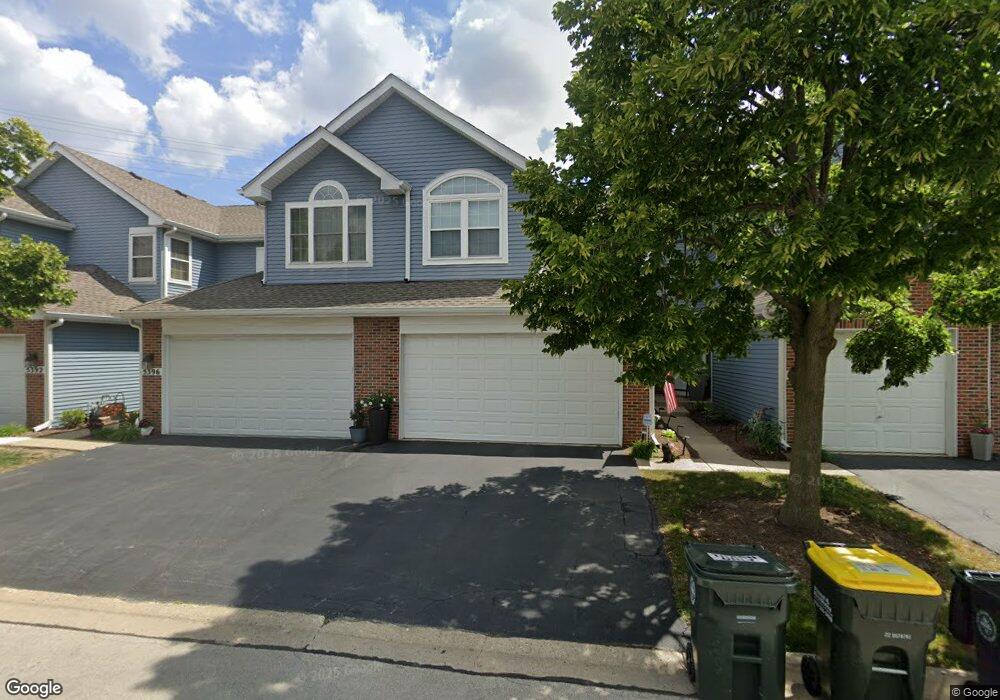
5400 Mayflower Ct Unit 2404 Rolling Meadows, IL 60008
Busse Woods NeighborhoodEstimated Value: $301,000 - $402,000
3
Beds
--
Bath
10,300
Sq Ft
$35/Sq Ft
Est. Value
About This Home
This home is located at 5400 Mayflower Ct Unit 2404, Rolling Meadows, IL 60008 and is currently estimated at $357,879, approximately $34 per square foot. 5400 Mayflower Ct Unit 2404 is a home located in Cook County with nearby schools including Willow Bend Elementary School, Gale School, and Carl Sandburg Junior High School.
Ownership History
Date
Name
Owned For
Owner Type
Purchase Details
Closed on
Jul 26, 2006
Sold by
Sales Girlie Consejo and Sales Cardito
Bought by
Radloff Evelyn
Current Estimated Value
Home Financials for this Owner
Home Financials are based on the most recent Mortgage that was taken out on this home.
Original Mortgage
$251,900
Outstanding Balance
$151,811
Interest Rate
6.83%
Mortgage Type
Unknown
Estimated Equity
$206,068
Purchase Details
Closed on
Oct 11, 2001
Sold by
Powers Kevin F and Powers Maria V
Bought by
Cosejo Sales Cardito F and Cosejo Sales Girlie
Home Financials for this Owner
Home Financials are based on the most recent Mortgage that was taken out on this home.
Original Mortgage
$221,350
Interest Rate
6.72%
Purchase Details
Closed on
Oct 30, 1997
Sold by
Kimball Hill Inc
Bought by
Powers Kevin F and Powers Maria V
Home Financials for this Owner
Home Financials are based on the most recent Mortgage that was taken out on this home.
Original Mortgage
$167,400
Interest Rate
7.36%
Create a Home Valuation Report for This Property
The Home Valuation Report is an in-depth analysis detailing your home's value as well as a comparison with similar homes in the area
Home Values in the Area
Average Home Value in this Area
Purchase History
| Date | Buyer | Sale Price | Title Company |
|---|---|---|---|
| Radloff Evelyn | $315,000 | Multiple | |
| Cosejo Sales Cardito F | $233,000 | -- | |
| Powers Kevin F | $176,500 | -- |
Source: Public Records
Mortgage History
| Date | Status | Borrower | Loan Amount |
|---|---|---|---|
| Open | Radloff Evelyn | $251,900 | |
| Previous Owner | Cosejo Sales Cardito F | $221,350 | |
| Previous Owner | Powers Kevin F | $167,400 |
Source: Public Records
Tax History Compared to Growth
Tax History
| Year | Tax Paid | Tax Assessment Tax Assessment Total Assessment is a certain percentage of the fair market value that is determined by local assessors to be the total taxable value of land and additions on the property. | Land | Improvement |
|---|---|---|---|---|
| 2024 | $7,437 | $27,668 | $3,313 | $24,355 |
| 2023 | $7,084 | $27,668 | $3,313 | $24,355 |
| 2022 | $7,084 | $27,668 | $3,313 | $24,355 |
| 2021 | $4,859 | $18,081 | $2,174 | $15,907 |
| 2020 | $4,818 | $18,081 | $2,174 | $15,907 |
| 2019 | $2,126 | $10,777 | $2,174 | $8,603 |
| 2018 | $5,491 | $20,465 | $1,863 | $18,602 |
| 2017 | $5,398 | $20,465 | $1,863 | $18,602 |
| 2016 | $5,286 | $20,465 | $1,863 | $18,602 |
| 2015 | $5,604 | $20,514 | $1,656 | $18,858 |
| 2014 | $5,488 | $20,514 | $1,656 | $18,858 |
| 2013 | $5,338 | $20,514 | $1,656 | $18,858 |
Source: Public Records
Map
Nearby Homes
- 1820 W Surrey Park Ln Unit 1B
- 5552 Elizabeth Place Unit 3102
- 1306 S New Wilke Rd Unit 2B
- 5550 Astor Ln Unit 317
- 1227 S Old Wilke Rd Unit 201
- 1227 S Old Wilke Rd Unit 306
- 5600 Astor Ln Unit 315
- 1217 S Old Wilke Rd Unit 11406
- 2402 Algonquin Rd Unit 9
- 2312 Algonquin Rd Unit 3
- 5500 Carriageway Dr Unit 213
- 1207 S Old Wilke Rd Unit 303
- 1206 S New Wilke Rd Unit 108
- 2504 Algonquin Rd Unit 14
- 2504 Algonquin Rd Unit 17
- 5200 Carriageway Dr Unit 101
- 2508 Algonquin Rd Unit 16
- 1117 S Old Wilke Rd Unit 206
- 1107 S Old Wilke Rd Unit 201
- 1010 W Haven Dr
- 5404 Mayflower Ct
- 5396 Mayflower Ct Unit 2403
- 5408 Mayflower Ct Unit 2406
- 5392 Mayflower Ct
- 5388 Mayflower Ct Unit 2401
- 5412 Mayflower Ct Unit 2501
- 5416 Mayflower Ct
- 5377 Mayflower Ct Unit 2306
- 5420 Mayflower Ct Unit 2503
- 5424 Mayflower Ct Unit 2504
- 5385 Mayflower Ct Unit 2304
- 5428 Mayflower Ct
- 5393 Mayflower Ct
- 5389 Mayflower Ct Unit 2303
- 5413 Mayflower Ct Unit 2203
- 5405 Mayflower Ct Unit 2205
- 5417 Mayflower Ct
- 5429 Mayflower Ct Unit 2104
- 5401 Mayflower Ct Unit 2206
- 5432 Mayflower Ct Unit 2506