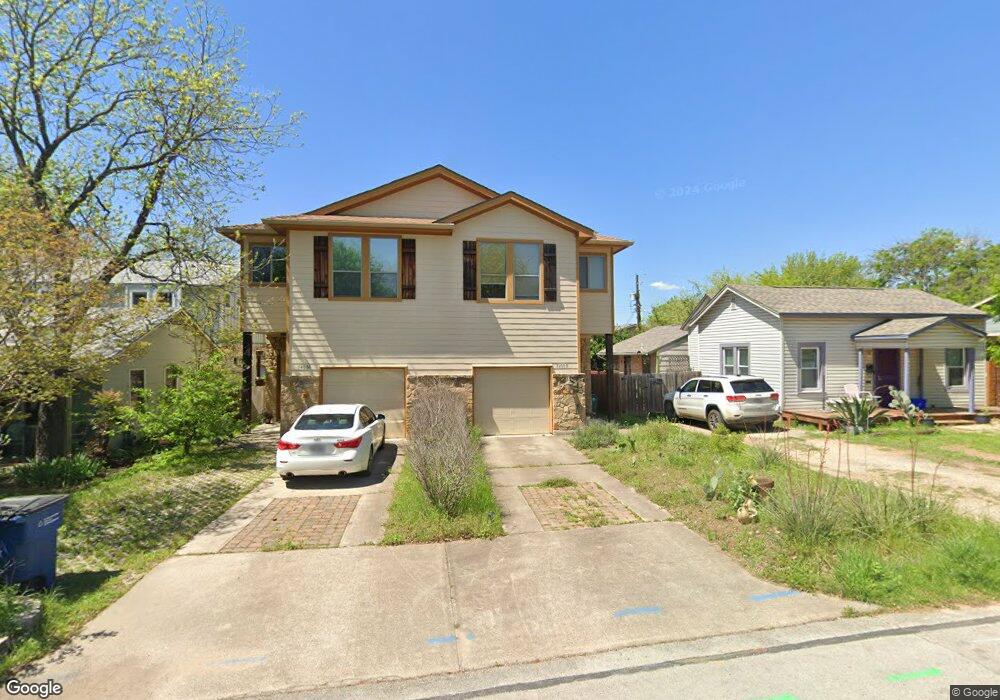
5400 Roosevelt Ave Unit A Austin, TX 78756
Brentwood NeighborhoodEstimated Value: $712,765 - $753,000
2
Beds
3
Baths
2,091
Sq Ft
$349/Sq Ft
Est. Value
About This Home
This home is located at 5400 Roosevelt Ave Unit A, Austin, TX 78756 and is currently estimated at $730,441, approximately $349 per square foot. 5400 Roosevelt Ave Unit A is a home located in Travis County with nearby schools including Brentwood Elementary School, Lamar Middle School, and McCallum High School.
Ownership History
Date
Name
Owned For
Owner Type
Purchase Details
Closed on
Nov 15, 2011
Sold by
Draper Deanna L and Thomas Michael
Bought by
Baldea Michael
Current Estimated Value
Home Financials for this Owner
Home Financials are based on the most recent Mortgage that was taken out on this home.
Original Mortgage
$193,500
Outstanding Balance
$18,736
Interest Rate
3.32%
Mortgage Type
New Conventional
Estimated Equity
$711,705
Purchase Details
Closed on
Jun 15, 2007
Sold by
Bruce Homes Lp
Bought by
Draper Deanna L
Home Financials for this Owner
Home Financials are based on the most recent Mortgage that was taken out on this home.
Original Mortgage
$257,600
Interest Rate
6.15%
Mortgage Type
Purchase Money Mortgage
Purchase Details
Closed on
Sep 20, 2005
Sold by
Perry Guy St J E and Perry Nicole
Bought by
Homes Carter Bruce
Create a Home Valuation Report for This Property
The Home Valuation Report is an in-depth analysis detailing your home's value as well as a comparison with similar homes in the area
Home Values in the Area
Average Home Value in this Area
Purchase History
| Date | Buyer | Sale Price | Title Company |
|---|---|---|---|
| Baldea Michael | -- | None Available | |
| Draper Deanna L | -- | First American Title | |
| Homes Carter Bruce | -- | -- |
Source: Public Records
Mortgage History
| Date | Status | Borrower | Loan Amount |
|---|---|---|---|
| Open | Baldea Michael | $193,500 | |
| Previous Owner | Draper Deanna L | $257,600 |
Source: Public Records
Tax History
| Year | Tax Paid | Tax Assessment Tax Assessment Total Assessment is a certain percentage of the fair market value that is determined by local assessors to be the total taxable value of land and additions on the property. | Land | Improvement |
|---|---|---|---|---|
| 2025 | $13,559 | $662,566 | $178,125 | $484,441 |
| 2023 | $15,017 | $830,000 | $225,000 | $605,000 |
| 2022 | $15,607 | $790,258 | $225,000 | $565,258 |
| 2021 | $11,170 | $513,150 | $150,000 | $421,852 |
| 2020 | $10,006 | $466,500 | $150,000 | $316,500 |
| 2018 | $9,618 | $434,426 | $150,000 | $294,924 |
| 2017 | $8,808 | $394,933 | $125,000 | $269,933 |
| 2016 | $8,130 | $364,553 | $125,000 | $239,553 |
| 2015 | $7,760 | $362,299 | $105,000 | $257,299 |
| 2014 | $7,760 | $351,177 | $85,000 | $266,177 |
Source: Public Records
Map
Nearby Homes
- 5313 Woodrow Ave Unit 1
- 5412 Grover Ave Unit A
- 5409 Woodrow Ave Unit D
- 5210 Woodrow Ave
- 5505 Joe Sayers Ave
- 5601 Woodrow Ave
- 5512 Joe Sayers Ave
- 5317 Mccandless St
- 5106 Woodrow Ave
- 1211 Georgian St
- 5604 Woodrow Ave Unit 15
- 5513 Jim Hogg Ave
- 5515 Jim Hogg Ave
- 5611 Joe Sayers Ave
- 5605 Sunshine Dr Unit 10
- 5606 1/2 Joe Sayers Ave
- 5607 Jim Hogg Ave
- 4914 Woodrow Ave
- 5504 William Holland Ave Unit A
- 820 Stark St
- 5400 Roosevelt Ave Unit B
- 5318 Roosevelt Ave
- 5402-B Roosevelt Ave
- 5402 Roosevelt Ave Unit A
- 5402 Roosevelt Ave
- 5402 Roosevelt Ave Unit B
- 5316 Roosevelt Ave
- 5404 Roosevelt Ave
- 5314 Roosevelt Ave
- 5406 Roosevelt Ave
- 5401 Woodrow Ave
- 5403 Roosevelt Ave
- 5403 Roosevelt Ave Unit 2
- 5319 Woodrow Ave
- 5403 Woodrow Ave
- 5401 Roosevelt Ave Unit A
- 5401 Roosevelt Ave
- 5319 Roosevelt Ave
- 5317 Woodrow Ave
- 5312 Roosevelt Ave
Your Personal Tour Guide
Ask me questions while you tour the home.