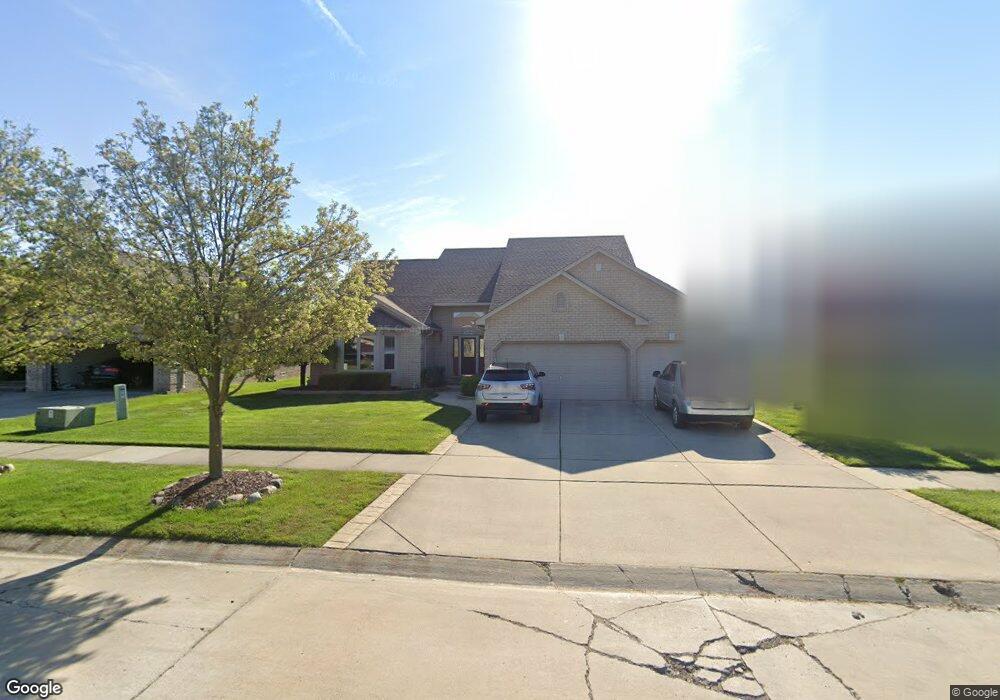
54006 Lily Dr Macomb, MI 48042
Estimated Value: $446,000 - $513,000
4
Beds
3
Baths
2,682
Sq Ft
$181/Sq Ft
Est. Value
About This Home
This home is located at 54006 Lily Dr, Macomb, MI 48042 and is currently estimated at $485,206, approximately $180 per square foot. 54006 Lily Dr is a home located in Macomb County with nearby schools including Richard J. Duncan Elementary, Shelby Junior High School, and Eisenhower High School.
Ownership History
Date
Name
Owned For
Owner Type
Purchase Details
Closed on
Aug 23, 2023
Sold by
Misch Jennifer
Bought by
Misch Jennifer and Misch Lauren
Current Estimated Value
Purchase Details
Closed on
Aug 20, 2013
Sold by
Misch Ronald G
Bought by
Misch Jennifer
Purchase Details
Closed on
Apr 15, 2005
Sold by
Colbert Terry A and Colbert Terry A
Bought by
Wells Fargo Bank and Certificate Holders Of Asset Backed Pass
Purchase Details
Closed on
Sep 21, 2000
Sold by
Star Construction
Bought by
Colbert Terry A
Home Financials for this Owner
Home Financials are based on the most recent Mortgage that was taken out on this home.
Original Mortgage
$40,875
Interest Rate
7.98%
Mortgage Type
Purchase Money Mortgage
Purchase Details
Closed on
Aug 5, 2000
Sold by
Princess Homes
Bought by
Colbert Terry A
Home Financials for this Owner
Home Financials are based on the most recent Mortgage that was taken out on this home.
Original Mortgage
$40,875
Interest Rate
7.98%
Mortgage Type
Purchase Money Mortgage
Create a Home Valuation Report for This Property
The Home Valuation Report is an in-depth analysis detailing your home's value as well as a comparison with similar homes in the area
Home Values in the Area
Average Home Value in this Area
Purchase History
| Date | Buyer | Sale Price | Title Company |
|---|---|---|---|
| Misch Jennifer | -- | None Listed On Document | |
| Misch Jennifer | -- | None Listed On Document | |
| Misch Jennifer | -- | None Available | |
| Wells Fargo Bank | $323,868 | -- | |
| Colbert Terry A | $272,500 | -- | |
| Colbert Terry A | $58,000 | -- |
Source: Public Records
Mortgage History
| Date | Status | Borrower | Loan Amount |
|---|---|---|---|
| Previous Owner | Colbert Terry A | $40,875 |
Source: Public Records
Tax History
| Year | Tax Paid | Tax Assessment Tax Assessment Total Assessment is a certain percentage of the fair market value that is determined by local assessors to be the total taxable value of land and additions on the property. | Land | Improvement |
|---|---|---|---|---|
| 2025 | $2,938 | $237,100 | $0 | $0 |
| 2024 | $29 | $225,100 | $0 | $0 |
| 2023 | $2,708 | $203,500 | $0 | $0 |
| 2022 | $3,911 | $187,900 | $0 | $0 |
| 2021 | $3,809 | $180,000 | $0 | $0 |
| 2020 | $2,493 | $171,700 | $0 | $0 |
| 2019 | $3,493 | $164,700 | $0 | $0 |
| 2018 | $3,455 | $154,300 | $0 | $0 |
| 2017 | $3,396 | $142,610 | $32,500 | $110,110 |
| 2016 | $3,196 | $142,650 | $0 | $0 |
| 2015 | $3,156 | $133,490 | $0 | $0 |
| 2014 | $3,156 | $125,830 | $21,500 | $104,330 |
| 2011 | $860 | $116,570 | $18,500 | $98,070 |
Source: Public Records
Map
Nearby Homes
- 54676 Carnation Dr
- 53428 Gregory Dr
- 16448 Trailway Dr
- 54680 Chickasaw Dr
- 53456 Fitzgerald Dr
- 16102 Thames Ln
- 54582 Ashley Lauren Dr
- 16701 25 Mile Rd
- 53650 Romeo Plank Rd
- 54990 Sherwood Ln
- 52204 Antler Dr
- 17646 Kite Dr
- 16767 Cobblestone West Blvd
- 55853 Tiger Dr
- 16414 Via Mera
- 15973 Via Colico
- 52244 Stoneridge Unit 121
- 52192 Southview Ridge
- 52163 Heatherstone Ave
- 16348 Via Montella
- 54034 Lily Dr
- 53978 Lily Dr
- 54021 Carnation Dr
- 54062 Lily Dr
- 54049 Carnation Dr
- 53993 Carnation Dr
- 54013 Lily Dr
- 54077 Carnation Dr
- 53985 Lily Dr
- 54041 Lily Dr
- 54090 Lily Dr
- 54069 Lily Dr
- 54105 Carnation Dr
- 16008 Myrtle Dr
- 15996 Myrtle Dr
- 16020 Myrtle Dr
- 54122 Lily Dr
- 15984 Myrtle Dr
- 54097 Lily Dr
- 16032 Myrtle Dr
Your Personal Tour Guide
Ask me questions while you tour the home.