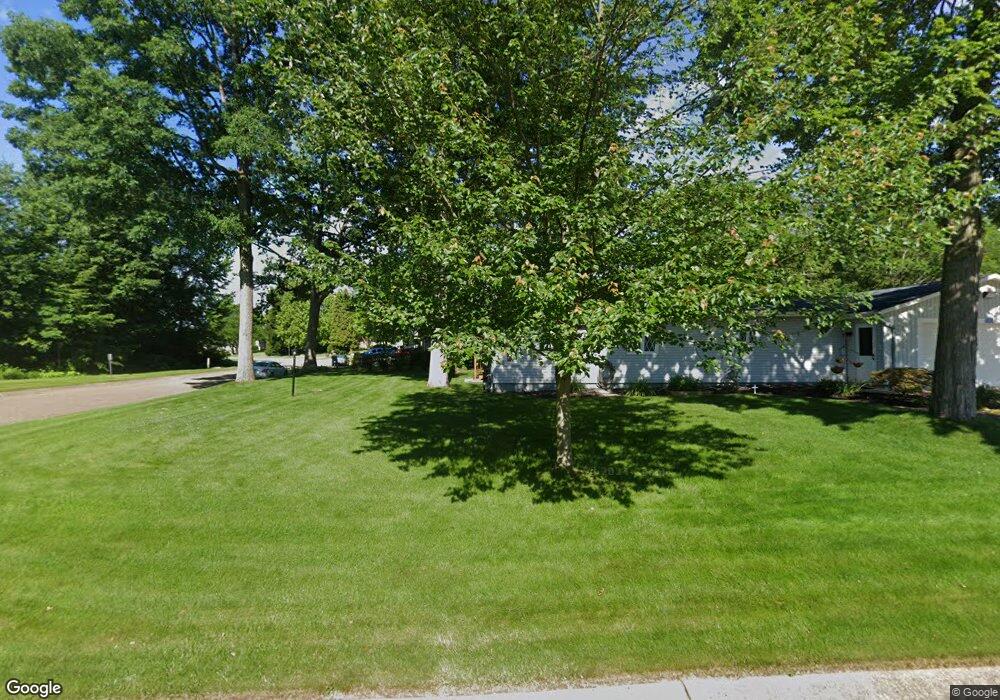
5401 Perry Hills Dr SW Canton, OH 44706
Estimated Value: $159,162 - $217,000
4
Beds
2
Baths
2,432
Sq Ft
$79/Sq Ft
Est. Value
About This Home
This home is located at 5401 Perry Hills Dr SW, Canton, OH 44706 and is currently estimated at $191,041, approximately $78 per square foot. 5401 Perry Hills Dr SW is a home located in Stark County with nearby schools including Pfeiffer Intermediate School, Edison Middle School, and Perry High School.
Ownership History
Date
Name
Owned For
Owner Type
Purchase Details
Closed on
Jul 17, 2008
Sold by
Hud
Bought by
Roby Jeanetta R
Current Estimated Value
Home Financials for this Owner
Home Financials are based on the most recent Mortgage that was taken out on this home.
Original Mortgage
$91,603
Outstanding Balance
$60,370
Interest Rate
6.5%
Mortgage Type
FHA
Estimated Equity
$130,671
Purchase Details
Closed on
Oct 1, 2007
Sold by
Waller Michael E and Waller Jasmin A
Bought by
Hud
Purchase Details
Closed on
Mar 17, 2000
Sold by
Guerrieri James S
Bought by
Waller Michael E and Waller Jasmin A
Home Financials for this Owner
Home Financials are based on the most recent Mortgage that was taken out on this home.
Original Mortgage
$124,438
Interest Rate
8.3%
Mortgage Type
FHA
Create a Home Valuation Report for This Property
The Home Valuation Report is an in-depth analysis detailing your home's value as well as a comparison with similar homes in the area
Home Values in the Area
Average Home Value in this Area
Purchase History
| Date | Buyer | Sale Price | Title Company |
|---|---|---|---|
| Roby Jeanetta R | $90,350 | Lakeside Title & Escrow Agen | |
| Hud | $84,000 | None Available | |
| Waller Michael E | $125,000 | -- |
Source: Public Records
Mortgage History
| Date | Status | Borrower | Loan Amount |
|---|---|---|---|
| Open | Roby Jeanetta R | $91,603 | |
| Previous Owner | Waller Michael E | $124,438 |
Source: Public Records
Tax History Compared to Growth
Tax History
| Year | Tax Paid | Tax Assessment Tax Assessment Total Assessment is a certain percentage of the fair market value that is determined by local assessors to be the total taxable value of land and additions on the property. | Land | Improvement |
|---|---|---|---|---|
| 2025 | -- | $38,680 | $12,880 | $25,800 |
| 2024 | -- | $38,680 | $12,880 | $25,800 |
| 2023 | $1,846 | $36,790 | $9,980 | $26,810 |
| 2022 | $1,856 | $36,790 | $9,980 | $26,810 |
| 2021 | $1,977 | $36,790 | $9,980 | $26,810 |
| 2020 | $1,947 | $34,760 | $9,240 | $25,520 |
| 2019 | $2,455 | $35,460 | $9,240 | $26,220 |
| 2018 | $2,119 | $35,460 | $9,240 | $26,220 |
| 2017 | $1,985 | $30,350 | $8,120 | $22,230 |
| 2016 | $1,976 | $30,350 | $8,120 | $22,230 |
| 2015 | $1,979 | $30,350 | $8,120 | $22,230 |
| 2014 | $46 | $27,200 | $7,280 | $19,920 |
| 2013 | $1,011 | $27,200 | $7,280 | $19,920 |
Source: Public Records
Map
Nearby Homes
- 5528 Oakcliff St SW
- 5292 Pisces St SW
- 2490 Lombardi Ave SW
- 2644 Delaware Ave SW
- 2611 Bordner Ave SW
- 2227 Perry Dr SW
- 2233 Genoa Ave SW
- 5616 Faircrest St SW
- 4722 Navarre Rd SW
- 0 Navarre Rd SW Unit 5093073
- 3827 Hazelbrook St SW
- 4696 Hurless Dr SW
- 0 Clark St SW Unit 5171557
- 4870 15th St SW
- 4871 15th St SW
- 317 Westland Ave SW
- 1425 Channonbrook St SW
- 2132 University Commons Dr SE Unit 2132
- 122 Westland Ave SW
- 119 Saratoga Ave SW
- 5385 Perry Hills Dr SW
- 2807 Middlebury Cir SW
- 5421 Perry Hills Dr SW
- 2801 Middlebury Cir SW
- 5435 Perry Hills Dr SW
- 2822 Middlebury Cir SW
- 2795 Middlebury Cir SW
- 2826 Wayland Cir SW
- 2806 Middlebury Cir SW
- 2791 Middlebury Cir SW
- 2822 Wayland Cir SW
- 5345 Perry Hills Dr SW
- 2790 Middlebury Cir SW
- 2800 Middlebury Cir SW
- 2794 Middlebury Cir SW
- 2913 Denise Cir SW
- 5420 Nave St SW
- 5447 Perry Hills Dr SW
- 2816 Wayland Cir SW
- 2907 Denise Cir SW