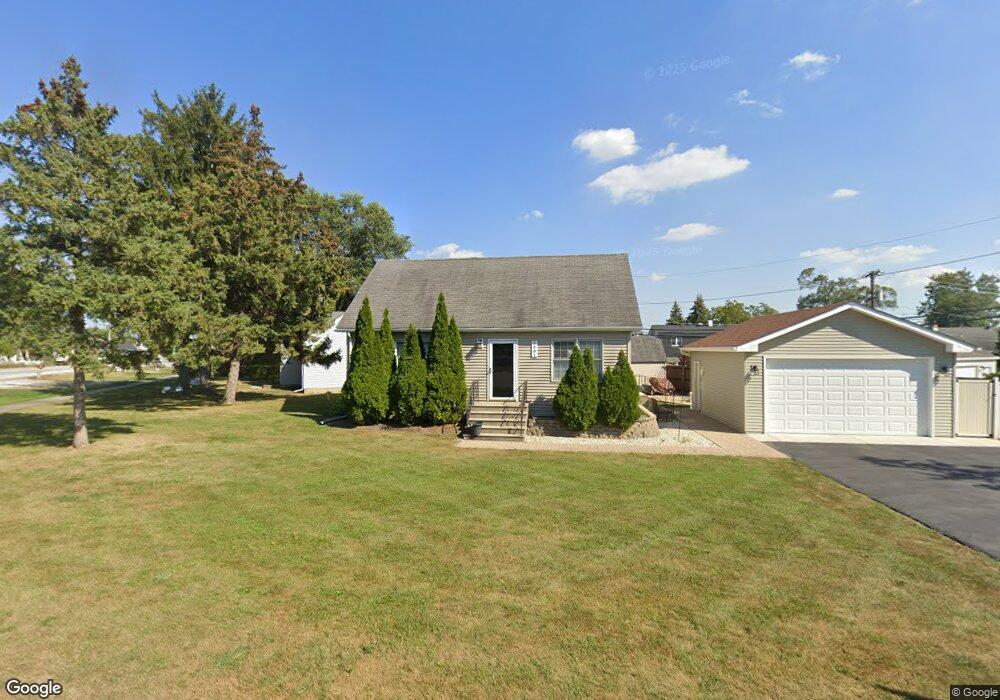
5401 S Ashland Ave Countryside, IL 60525
Estimated Value: $376,000 - $518,000
3
Beds
1
Bath
1,306
Sq Ft
$325/Sq Ft
Est. Value
About This Home
This home is located at 5401 S Ashland Ave, Countryside, IL 60525 and is currently estimated at $424,839, approximately $325 per square foot. 5401 S Ashland Ave is a home located in Cook County with nearby schools including Spring Avenue Elementary School, William F. Gurrie Middle School, and Lyons Township High School.
Ownership History
Date
Name
Owned For
Owner Type
Purchase Details
Closed on
May 8, 2002
Sold by
Perisich Anton R and Perisich Suzanne K
Bought by
Perisich Anton R and Perisich Suzanne K
Current Estimated Value
Home Financials for this Owner
Home Financials are based on the most recent Mortgage that was taken out on this home.
Original Mortgage
$176,000
Interest Rate
7.16%
Purchase Details
Closed on
May 21, 1997
Sold by
Perisich Anton R
Bought by
Perisich Anton R and Hull Suzanne K
Purchase Details
Closed on
Dec 30, 1993
Sold by
Mussatto Ray and Mussatto Joyce
Bought by
Perisich Anton R
Home Financials for this Owner
Home Financials are based on the most recent Mortgage that was taken out on this home.
Original Mortgage
$116,235
Interest Rate
7.26%
Mortgage Type
FHA
Create a Home Valuation Report for This Property
The Home Valuation Report is an in-depth analysis detailing your home's value as well as a comparison with similar homes in the area
Home Values in the Area
Average Home Value in this Area
Purchase History
| Date | Buyer | Sale Price | Title Company |
|---|---|---|---|
| Perisich Anton R | -- | -- | |
| Perisich Anton R | -- | -- | |
| Perisich Anton R | $117,000 | -- |
Source: Public Records
Mortgage History
| Date | Status | Borrower | Loan Amount |
|---|---|---|---|
| Closed | Perisich Anton R | $176,000 | |
| Closed | Perisich Anton R | $116,235 |
Source: Public Records
Tax History Compared to Growth
Tax History
| Year | Tax Paid | Tax Assessment Tax Assessment Total Assessment is a certain percentage of the fair market value that is determined by local assessors to be the total taxable value of land and additions on the property. | Land | Improvement |
|---|---|---|---|---|
| 2024 | $5,610 | $27,151 | $5,013 | $22,138 |
| 2023 | $4,865 | $29,645 | $5,013 | $24,632 |
| 2022 | $4,865 | $22,755 | $4,321 | $18,434 |
| 2021 | $4,703 | $22,754 | $4,321 | $18,433 |
| 2020 | $4,597 | $22,754 | $4,321 | $18,433 |
| 2019 | $4,772 | $23,604 | $3,975 | $19,629 |
| 2018 | $4,724 | $23,604 | $3,975 | $19,629 |
| 2017 | $4,601 | $23,604 | $3,975 | $19,629 |
| 2016 | $5,084 | $23,428 | $3,457 | $19,971 |
| 2015 | $4,979 | $23,428 | $3,457 | $19,971 |
| 2014 | $4,894 | $23,428 | $3,457 | $19,971 |
| 2013 | $4,805 | $23,710 | $3,457 | $20,253 |
Source: Public Records
Map
Nearby Homes
- 5348 6th Ave
- 1140 S Stone Ave
- 301 E Plainfield Rd Unit 6
- 1001 S Brainard Ave
- 9803 W 57th St
- 5811 Longview Dr Unit 2
- 736 S Ashland Ave
- 715 S Catherine Ave
- 5441 S Edgewood Ave
- 5626 East Ave
- 617 S Madison Ave
- 1316 W 55th St
- 5547 S Peck Ave
- 600 8th Ave
- 1392 W 52nd Place
- 524 S Ashland Ave
- 510 S 6th Ave
- 814 61st St
- 119 Pheasant Dr
- 509 S Brainard Ave
- 10107 W Plainfield Rd
- 10105 W Plainfield Rd
- 10105 W Plainfield Rd
- 5411 S Ashland Ave
- 10308 W Plainfield Rd
- 10308 W Plainfield Rd
- 10308 W Plainfield Rd
- 10103 W Plainfield Rd
- 10103 W Plainfield Rd
- 5428 S Madison Ave
- 5417 S Ashland Ave
- 5410 S Madison Ave
- 5430 S Madison Ave
- 212 W Plainfield Rd
- 5400 S Madison Ave
- 5400 S Madison Ave
- 5419 S Ashland Ave
- 5434 S Madison Ave
- 201 W Plainfield Rd
- 201 W Plainfield Rd