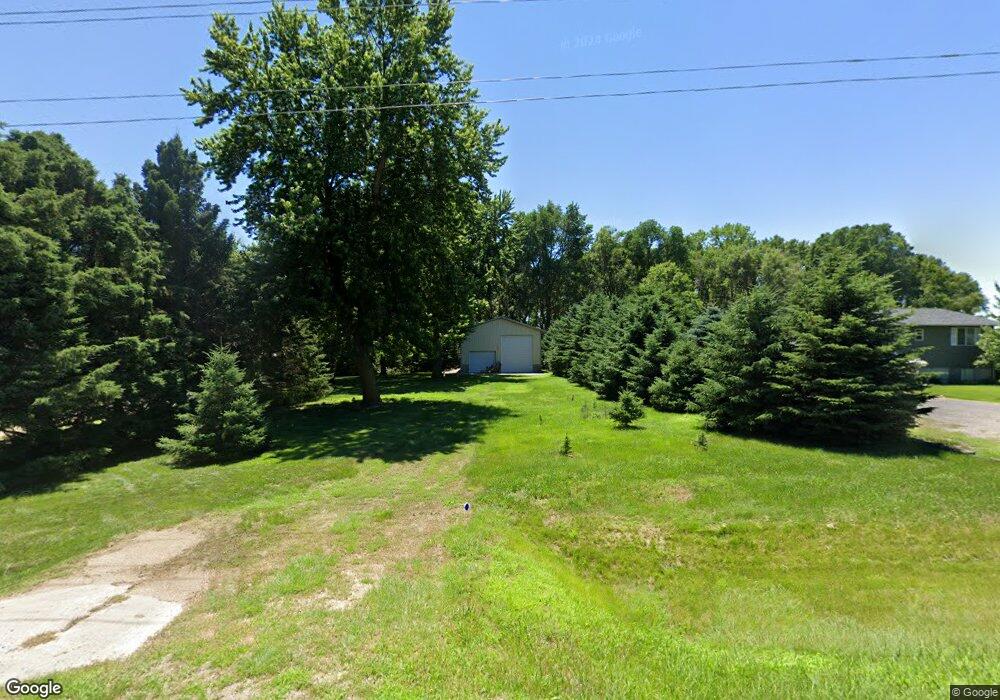
5401 W South Airport Rd Norfolk, NE 68701
Estimated Value: $216,422 - $328,000
2
Beds
1
Bath
1,008
Sq Ft
$265/Sq Ft
Est. Value
About This Home
This home is located at 5401 W South Airport Rd, Norfolk, NE 68701 and is currently estimated at $267,106, approximately $264 per square foot. 5401 W South Airport Rd is a home located in Madison County with nearby schools including Battle Creek Elementary School and Battle Creek High School.
Ownership History
Date
Name
Owned For
Owner Type
Purchase Details
Closed on
Feb 5, 2009
Sold by
Goodwater Christopher N
Bought by
Goodwater Christopher N and Goodwater Sara M
Current Estimated Value
Home Financials for this Owner
Home Financials are based on the most recent Mortgage that was taken out on this home.
Original Mortgage
$111,161
Outstanding Balance
$69,550
Interest Rate
4.91%
Mortgage Type
FHA
Estimated Equity
$197,556
Purchase Details
Closed on
Aug 3, 2007
Sold by
Wisnieski Donald and Wisnieski Jolene
Bought by
Goodwater Christopher N
Home Financials for this Owner
Home Financials are based on the most recent Mortgage that was taken out on this home.
Original Mortgage
$87,000
Interest Rate
6.64%
Mortgage Type
New Conventional
Purchase Details
Closed on
Feb 19, 2007
Sold by
Wisnieski Brent T and Wisnieski April J
Bought by
Wisnieski Donald and Wisnieski Jolene
Purchase Details
Closed on
Jun 11, 2004
Sold by
Weyers Kevin J and Weyers Trudy S
Bought by
Wisnieski Brent T and Wisnieski April J
Create a Home Valuation Report for This Property
The Home Valuation Report is an in-depth analysis detailing your home's value as well as a comparison with similar homes in the area
Home Values in the Area
Average Home Value in this Area
Purchase History
| Date | Buyer | Sale Price | Title Company |
|---|---|---|---|
| Goodwater Christopher N | -- | -- | |
| Goodwarter Chhristopher N | -- | None Available | |
| Goodwater Christopher N | $87,000 | -- | |
| Wisnieski Donald | $12,000 | -- | |
| Wisnieski Donald W | $12,000 | None Available | |
| Wisnieski Brent T | $8,400 | -- |
Source: Public Records
Mortgage History
| Date | Status | Borrower | Loan Amount |
|---|---|---|---|
| Open | Goodwater Christopher N | $111,161 | |
| Closed | Goodwater Christopher N | $87,000 |
Source: Public Records
Tax History Compared to Growth
Tax History
| Year | Tax Paid | Tax Assessment Tax Assessment Total Assessment is a certain percentage of the fair market value that is determined by local assessors to be the total taxable value of land and additions on the property. | Land | Improvement |
|---|---|---|---|---|
| 2024 | $1,539 | $176,089 | $8,500 | $167,589 |
| 2023 | $2,172 | $158,133 | $8,500 | $149,633 |
| 2022 | $1,920 | $139,757 | $8,500 | $131,257 |
| 2021 | $1,675 | $125,694 | $8,500 | $117,194 |
| 2020 | $1,658 | $125,694 | $8,500 | $117,194 |
| 2019 | $1,534 | $117,013 | $8,500 | $108,513 |
| 2018 | $1,329 | $108,053 | $8,500 | $99,553 |
| 2017 | $1,246 | $99,833 | $8,500 | $91,333 |
| 2016 | $1,210 | $92,292 | $8,500 | $83,792 |
| 2015 | $1,199 | $92,292 | $8,500 | $83,792 |
| 2014 | $1,200 | $85,373 | $8,500 | $76,873 |
| 2013 | $1,404 | $85,373 | $8,500 | $76,873 |
Source: Public Records
Map
Nearby Homes
- 5105 W Sherwood Rd
- 0 See Legal Unit 250827
- 3507 Bradford Ave
- 3407 Bradford Ave
- 3506 Bradford Ave
- 3406 Bradford Ave
- 3900 Madison Ave
- 101 Frank Ave
- 101 Adealia Ave
- 100 Henry Ave
- 2500 W Pasewalk
- 101 Henry Ave
- 100 Helen Ave
- 2500 W Cooper Dr **
- 2604 W Cooper Dr**
- 803 N 34th St
- 1201 N 34th St
- 1103 N 34th St
- 2510 Westside Ave
- 2508 Westside Ave
- 5309 W South Airport Rd
- 5305 W South Airport Rd
- 5407 W South Airport Rd
- 5207 W South Airport Rd
- 5408 W South Airport Rd
- 5404 W South Airport Rd
- 5206 W South Airport Rd
- 5300 W South Airport Rd
- 5109 W South Airport Rd
- 5508 W South Airport Rd
- 5106 W South Airport Rd
- 5105 W South Airport Rd
- 5710 W South Airport Rd
- 4306 S 49th St
- 4702 S 49th St
- 4506 S 49th St
- 83860 551st Ave
- 83831 551st Ave
- 83741 552nd Ave
- 83742 552nd Ave