5404 Brittlebush Way Las Vegas, NV 89130
North Cheyenne NeighborhoodEstimated Value: $457,291 - $530,000
3
Beds
2
Baths
2,118
Sq Ft
$235/Sq Ft
Est. Value
About This Home
This home is located at 5404 Brittlebush Way, Las Vegas, NV 89130 and is currently estimated at $497,573, approximately $234 per square foot. 5404 Brittlebush Way is a home located in Clark County with nearby schools including Ernest May Elementary School, Theron L Swainston Middle School, and Shadow Ridge High School.
Ownership History
Date
Name
Owned For
Owner Type
Purchase Details
Closed on
Jul 27, 2023
Sold by
Kim Angela I
Bought by
Kim Han J
Current Estimated Value
Purchase Details
Closed on
Jun 26, 2023
Sold by
Kim Edward Young Ji
Bought by
Kim Angela I
Purchase Details
Closed on
Sep 3, 2010
Sold by
Us Bank National Association
Bought by
Kim Edward Y and Kim Angela I
Purchase Details
Closed on
Jun 4, 2010
Sold by
Rexroad Matthew Mark
Bought by
Us Bank National Association
Purchase Details
Closed on
Mar 21, 2005
Sold by
Goldberg Marian R
Bought by
Rexroad Matthew Mark
Home Financials for this Owner
Home Financials are based on the most recent Mortgage that was taken out on this home.
Original Mortgage
$280,000
Interest Rate
5.92%
Mortgage Type
Fannie Mae Freddie Mac
Create a Home Valuation Report for This Property
The Home Valuation Report is an in-depth analysis detailing your home's value as well as a comparison with similar homes in the area
Home Values in the Area
Average Home Value in this Area
Purchase History
| Date | Buyer | Sale Price | Title Company |
|---|---|---|---|
| Kim Han J | -- | None Listed On Document | |
| Kim Angela I | -- | -- | |
| Kim Edward Y | $159,000 | First American Title Paseo | |
| Us Bank National Association | $182,750 | Accommodation | |
| Rexroad Matthew Mark | $350,000 | First Amer Title Co Of Nv |
Source: Public Records
Mortgage History
| Date | Status | Borrower | Loan Amount |
|---|---|---|---|
| Previous Owner | Rexroad Matthew Mark | $280,000 |
Source: Public Records
Tax History Compared to Growth
Tax History
| Year | Tax Paid | Tax Assessment Tax Assessment Total Assessment is a certain percentage of the fair market value that is determined by local assessors to be the total taxable value of land and additions on the property. | Land | Improvement |
|---|---|---|---|---|
| 2025 | $2,112 | $103,192 | $34,300 | $68,892 |
| 2024 | $2,051 | $103,192 | $34,300 | $68,892 |
| 2023 | $2,051 | $100,825 | $35,000 | $65,825 |
| 2022 | $1,992 | $87,790 | $27,300 | $60,490 |
| 2021 | $1,934 | $82,332 | $24,500 | $57,832 |
| 2020 | $1,875 | $81,074 | $23,450 | $57,624 |
| 2019 | $1,820 | $77,599 | $20,650 | $56,949 |
| 2018 | $1,767 | $72,842 | $17,850 | $54,992 |
| 2017 | $2,337 | $71,294 | $15,400 | $55,894 |
| 2016 | $1,674 | $66,941 | $12,250 | $54,691 |
| 2015 | $1,670 | $59,888 | $8,750 | $51,138 |
| 2014 | $1,621 | $47,979 | $8,750 | $39,229 |
Source: Public Records
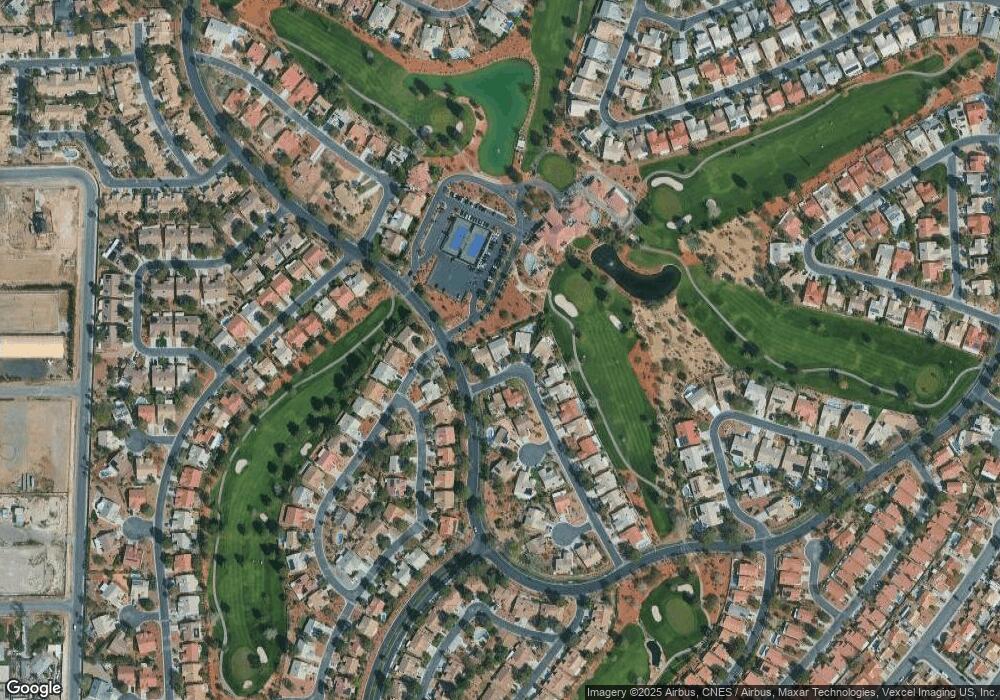
Map
Nearby Homes
- 5004 Rancho Bernardo Way
- 5204 Rim View Ln
- 4933 Fiesta Lakes St
- 5021 Cliffrose Dr
- 5600 Segolilly Cir
- 4905 Ocean Shores Way
- 5017 Cliffrose Dr
- 4872 Maryvale Dr
- 5005 Cliffrose Dr
- 5605 Bay Shore Cir
- 5100 Elm Grove Dr
- 4833 Fiesta Lakes St
- 4852 Maryvale Dr
- 4821 Fiesta Lakes St
- 4816 Fiesta Lakes St
- 4817 Friar Ln
- 5333 Rim View Ln
- 5133 Burr Oak Dr
- 4808 Fiesta Lakes St
- 5216 Desert Star Dr
- 5408 Brittlebush Way
- 5400 Brittlebush Way
- 5140 Wild Marigold Dr
- 5405 Brittlebush Way
- 5136 Wild Marigold Dr
- 5409 Brittlebush Way
- 5132 Wild Marigold Dr
- 5124 Mandrake Ln
- 5400 Corkseed Ct
- 5121 Pacific Grove Dr
- 5120 Mandrake Ln
- 5404 Corkseed Ct
- 5128 Wild Marigold Dr
- 5117 Pacific Grove Dr
- 5116 Mandrake Ln
- 5124 Wild Marigold Dr
- 5113 Pacific Grove Dr
- 5112 Mandrake Ln
- 5408 Corkseed Ct
- 5120 Wild Marigold Dr