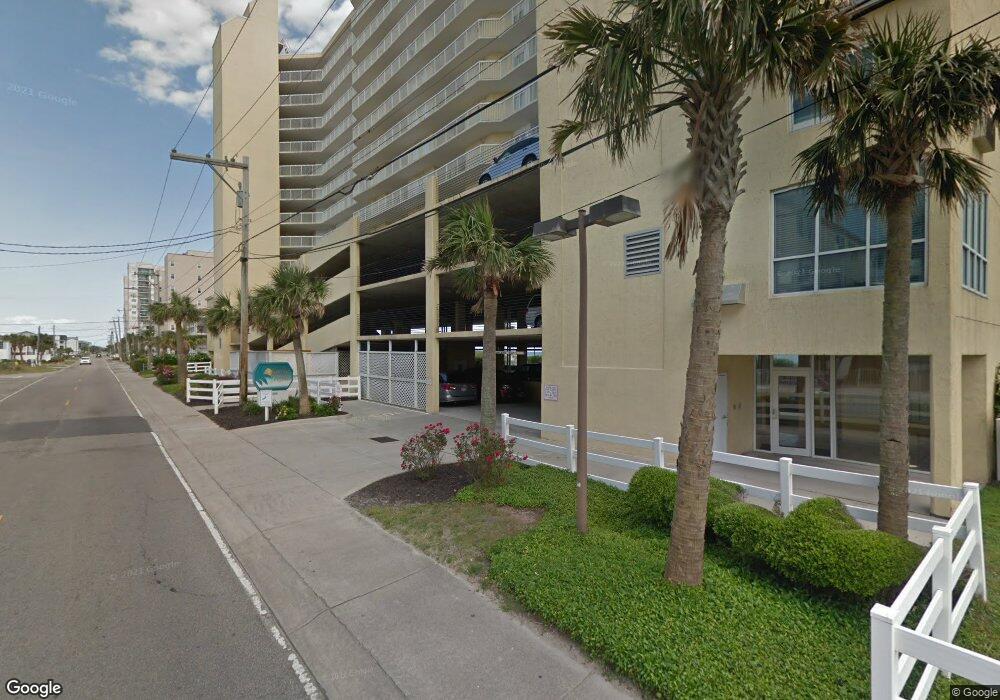
Sunrise Pointe 5404 N Ocean Blvd Unit Sunrise Pointe 11D North Myrtle Beach, SC 29582
Cherry Grove NeighborhoodEstimated Value: $541,164 - $555,000
3
Beds
3
Baths
1,350
Sq Ft
$406/Sq Ft
Est. Value
About This Home
This home is located at 5404 N Ocean Blvd Unit Sunrise Pointe 11D, North Myrtle Beach, SC 29582 and is currently estimated at $548,041, approximately $405 per square foot. 5404 N Ocean Blvd Unit Sunrise Pointe 11D is a home located in Horry County with nearby schools including Ocean Drive Elementary School, North Myrtle Beach Middle School, and North Myrtle Beach High School.
Ownership History
Date
Name
Owned For
Owner Type
Purchase Details
Closed on
Mar 1, 2016
Sold by
Slovic John
Bought by
Elegant Propertiesllc
Current Estimated Value
Purchase Details
Closed on
May 10, 2013
Sold by
Russell Frank C
Bought by
Slovic John
Purchase Details
Closed on
Oct 21, 2005
Sold by
Rees 375 Llc
Bought by
Russell Frank C and Russell Rena G
Purchase Details
Closed on
Apr 26, 2005
Sold by
Dills Michael K and Karriker Vickie L
Bought by
Rees 375 Llc
Home Financials for this Owner
Home Financials are based on the most recent Mortgage that was taken out on this home.
Original Mortgage
$505,715
Interest Rate
5.98%
Mortgage Type
Unknown
Purchase Details
Closed on
Oct 25, 2002
Sold by
Christopher Development Corp Iii
Bought by
Dills Michael K and Karriker Vickie L
Create a Home Valuation Report for This Property
The Home Valuation Report is an in-depth analysis detailing your home's value as well as a comparison with similar homes in the area
Home Values in the Area
Average Home Value in this Area
Purchase History
| Date | Buyer | Sale Price | Title Company |
|---|---|---|---|
| Elegant Propertiesllc | -- | -- | |
| Slovic John | $250,000 | -- | |
| Russell Frank C | $505,715 | -- | |
| Rees 375 Llc | $500,000 | -- | |
| Dills Michael K | $279,900 | -- |
Source: Public Records
Mortgage History
| Date | Status | Borrower | Loan Amount |
|---|---|---|---|
| Previous Owner | Rees 375 Llc | $505,715 |
Source: Public Records
Tax History Compared to Growth
Tax History
| Year | Tax Paid | Tax Assessment Tax Assessment Total Assessment is a certain percentage of the fair market value that is determined by local assessors to be the total taxable value of land and additions on the property. | Land | Improvement |
|---|---|---|---|---|
| 2024 | -- | $30,960 | $0 | $30,960 |
| 2023 | $0 | $30,450 | $0 | $30,450 |
| 2021 | $3,938 | $30,450 | $0 | $30,450 |
| 2020 | $3,894 | $30,450 | $0 | $30,450 |
| 2019 | $3,757 | $30,450 | $0 | $30,450 |
| 2018 | $0 | $28,770 | $0 | $28,770 |
| 2017 | $0 | $16,440 | $0 | $16,440 |
| 2016 | $0 | $15,000 | $0 | $15,000 |
| 2015 | -- | $26,250 | $0 | $26,250 |
| 2014 | $3,264 | $15,000 | $0 | $15,000 |
Source: Public Records
About Sunrise Pointe
Map
Nearby Homes
- 5409 N Ocean Blvd Unit 101 The Hartford In
- 5409 N Ocean Blvd Unit 100
- 5409 N Ocean Blvd Unit 111 The Hartford In
- 5409 N Ocean Blvd Unit 106/7,108
- 5310 N Ocean Blvd Unit 10B
- 5310 N Ocean Blvd Unit 7C
- 200 53rd Ave N Unit 207
- 200 53rd Ave N Unit 511
- 200 53rd Ave N Unit 409
- 205 56th Ave N
- 5300 N Ocean Blvd Unit B
- 5301 N Ocean Blvd Unit 405 Cherry Grove Vil
- 5600 N Ocean Blvd Unit A8
- 5600 N Ocean Blvd Unit A11
- 5600 N Ocean Blvd Unit B3
- 206B 56th Ave N
- 308 54th Ave N
- 307 53rd Ave N
- 5203 N Ocean Blvd
- 5201 N Ocean Blvd Unit 41
- 5404 N Ocean Blvd Unit 11-G
- 5404 N Ocean Blvd Unit 11-C
- 5404 N Ocean Blvd Unit 11-G
- 5404 N Ocean Blvd Unit 8E Sunrise Pointe
- 5404 N Ocean Blvd Unit 8E Sunrise Point
- 5404 N Ocean Blvd Unit Sunrise Pointe 6-G
- 5404 N Ocean Blvd Unit SUNRISE POINTE 7-D
- 5404 N Ocean Blvd Unit Sunrise Pointe 11B
- 5404 N Ocean Blvd Unit Sunrise Pointe 8-C
- 5404 N Ocean Blvd Unit 4-C SUNRISE POINTE
- 5404 N Ocean Blvd Unit Sunrise Pointe 5B
- 5404 N Ocean Blvd Unit Sunrise Pointe 8-D
- 5404 N Ocean Blvd Unit Surnrise Pointe 4B
- 5404 N Ocean Blvd Unit 11-E Sunrise Pointe
- 5404 N Ocean Blvd Unit Sunrise Pointe Unit
- 5404 N Ocean Blvd Unit Sunrise Pointe 11F
- 5404 N Ocean Blvd Unit 4-G Sunrise Point
- 5404 N Ocean Blvd Unit 7G Sunrise Pointe
- 5404 N Ocean Blvd Unit 9E Sunrise Pointe
- 5404 N Ocean Blvd Unit SUNRISE POINTE