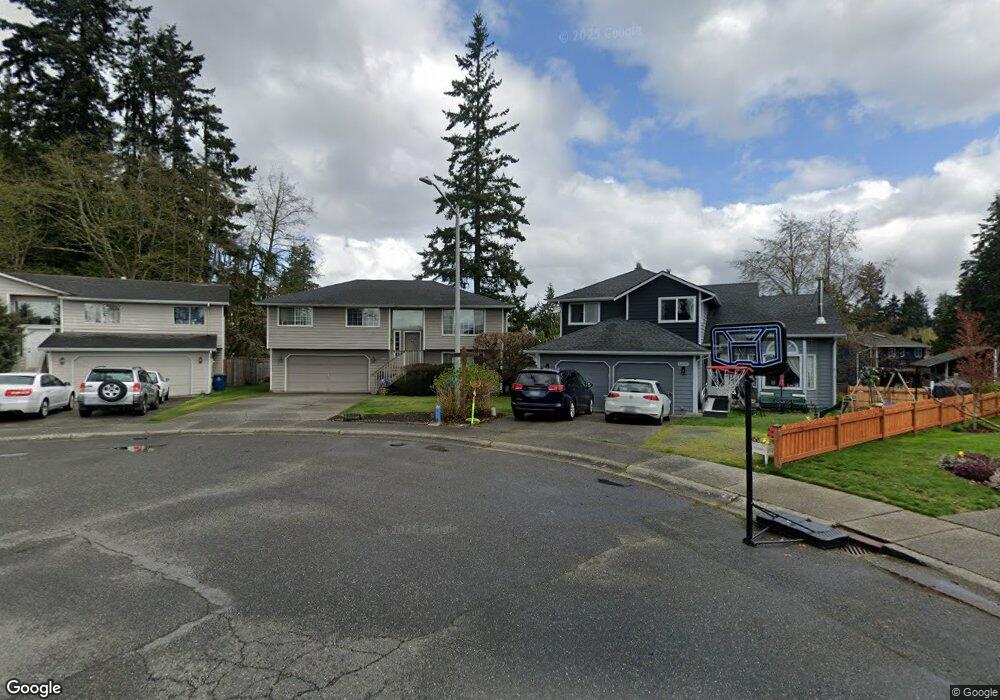
5405 158th Place SW Edmonds, WA 98026
Estimated Value: $779,082 - $897,000
3
Beds
3
Baths
504
Sq Ft
$1,651/Sq Ft
Est. Value
About This Home
This home is located at 5405 158th Place SW, Edmonds, WA 98026 and is currently estimated at $832,271, approximately $1,651 per square foot. 5405 158th Place SW is a home located in Snohomish County with nearby schools including Beverly Elementary School, Meadowdale Middle School, and Meadowdale High School.
Ownership History
Date
Name
Owned For
Owner Type
Purchase Details
Closed on
Jun 27, 2003
Sold by
Jansen Russell L and Jansen Mavis A
Bought by
Jansen Jeffery L and Jansen Kimberly N
Current Estimated Value
Home Financials for this Owner
Home Financials are based on the most recent Mortgage that was taken out on this home.
Original Mortgage
$141,000
Interest Rate
5.26%
Mortgage Type
Unknown
Purchase Details
Closed on
Nov 13, 1996
Sold by
Klassen Robert G and Klassen Stacey L
Bought by
Jansen Jeffrey L and Jansen Russell L
Home Financials for this Owner
Home Financials are based on the most recent Mortgage that was taken out on this home.
Original Mortgage
$138,550
Interest Rate
8.06%
Purchase Details
Closed on
Oct 4, 1993
Sold by
Short James S and Short Jeraldine R
Bought by
Klassen Robert G and Klassen Stacey L
Home Financials for this Owner
Home Financials are based on the most recent Mortgage that was taken out on this home.
Original Mortgage
$127,600
Interest Rate
6.98%
Create a Home Valuation Report for This Property
The Home Valuation Report is an in-depth analysis detailing your home's value as well as a comparison with similar homes in the area
Home Values in the Area
Average Home Value in this Area
Purchase History
| Date | Buyer | Sale Price | Title Company |
|---|---|---|---|
| Jansen Jeffery L | $11,235 | Chicago Title Insurance Co | |
| Jansen Jeffrey L | $163,000 | -- | |
| Klassen Robert G | $159,609 | Chicago Title Insurance Co |
Source: Public Records
Mortgage History
| Date | Status | Borrower | Loan Amount |
|---|---|---|---|
| Closed | Jansen Jeffery L | $141,000 | |
| Closed | Jansen Jeffrey L | $138,550 | |
| Previous Owner | Klassen Robert G | $127,600 |
Source: Public Records
Tax History Compared to Growth
Tax History
| Year | Tax Paid | Tax Assessment Tax Assessment Total Assessment is a certain percentage of the fair market value that is determined by local assessors to be the total taxable value of land and additions on the property. | Land | Improvement |
|---|---|---|---|---|
| 2025 | $5,508 | $699,900 | $462,000 | $237,900 |
| 2024 | $5,508 | $660,900 | $423,000 | $237,900 |
| 2023 | $5,604 | $703,000 | $428,000 | $275,000 |
| 2022 | $5,322 | $543,800 | $311,000 | $232,800 |
| 2020 | $5,090 | $459,900 | $260,000 | $199,900 |
| 2019 | $4,802 | $431,600 | $238,000 | $193,600 |
| 2018 | $4,935 | $391,200 | $216,000 | $175,200 |
| 2017 | $4,200 | $344,100 | $181,000 | $163,100 |
| 2016 | $3,854 | $316,400 | $160,000 | $156,400 |
| 2015 | $3,752 | $292,600 | $149,000 | $143,600 |
| 2013 | $3,123 | $230,300 | $113,000 | $117,300 |
Source: Public Records
Map
Nearby Homes
- 5411 158th Place SW
- 5404 158th Place SW
- 15914 52nd Ave W
- 5031 158th St SW
- 5719 160th St SW
- 5725 160th St SW
- 5727 160th St SW
- 16027 57th Ave W
- 16033 57th Ave W
- 5712 160th St SW
- 5714 160th St SW
- 5728 160th St SW
- 5921 160th St SW
- 5023 161st Place SW
- 5724 161st St SW
- 5726 161st Place SW
- Indigo Plan at Edmonds Ridge
- Lotus Plan at Edmonds Ridge
- Spirea Plan at Edmonds Ridge
- Verbena Plan at Edmonds Ridge
- 15826 53rd Place W
- 15814 53rd Place W
- 5417 158th Place SW
- 5410 158th Place SW
- 15732 53rd Place W
- 5330 158th Place SW
- 5423 158th Place SW
- 5416 158th Place SW
- 15724 53rd Place W
- 5422 158th Place SW
- 5324 158th Place SW
- 5429 158th Place SW
- 5419 160th St SW
- 5428 158th Place SW
- 15817 53rd Place W
- 15902 53rd Place W
- 15718 53rd Place W
- 5314 158th Place SW
- 15809 53rd Place W
- 15907 54th Place W