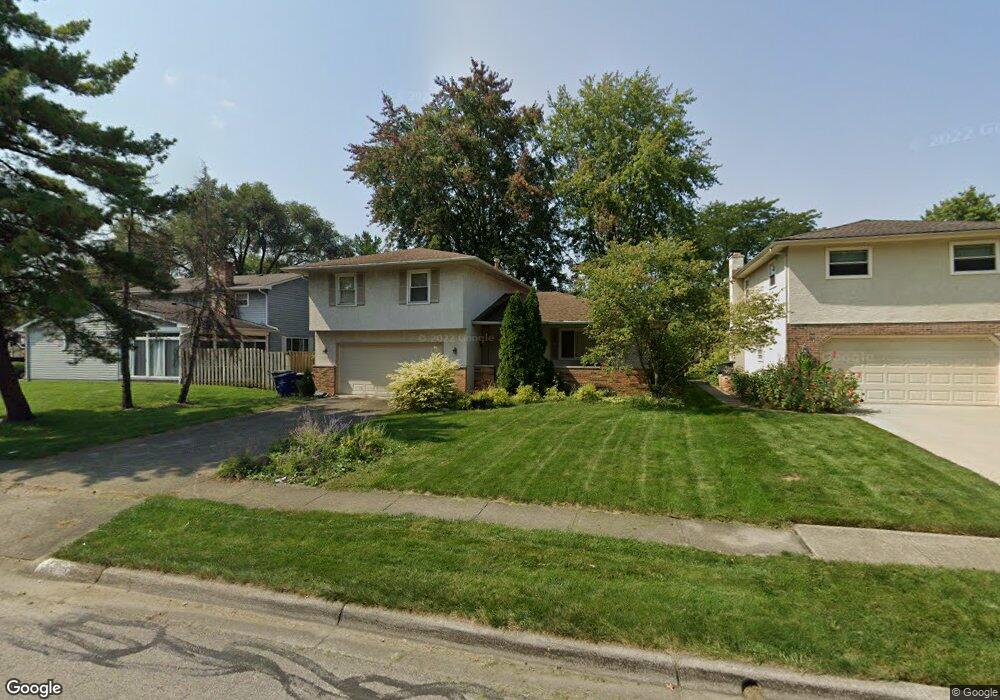
5405 Pine Bluff Rd Columbus, OH 43229
Forest Park East NeighborhoodEstimated Value: $283,399 - $310,000
3
Beds
3
Baths
1,621
Sq Ft
$184/Sq Ft
Est. Value
About This Home
This home is located at 5405 Pine Bluff Rd, Columbus, OH 43229 and is currently estimated at $298,100, approximately $183 per square foot. 5405 Pine Bluff Rd is a home located in Franklin County with nearby schools including Parkmoor Elementary School, Woodward Park Middle School, and Northland High School.
Ownership History
Date
Name
Owned For
Owner Type
Purchase Details
Closed on
May 15, 2009
Sold by
Pate Roy L
Bought by
Pate Kathleen A
Current Estimated Value
Purchase Details
Closed on
Jul 29, 2005
Sold by
Tincher John D and Soto Soraya
Bought by
Pate Kathleen
Purchase Details
Closed on
Jun 16, 1999
Sold by
Otto Beverly
Bought by
Tincher John D and Soto Soraya
Home Financials for this Owner
Home Financials are based on the most recent Mortgage that was taken out on this home.
Original Mortgage
$95,600
Interest Rate
7.06%
Create a Home Valuation Report for This Property
The Home Valuation Report is an in-depth analysis detailing your home's value as well as a comparison with similar homes in the area
Home Values in the Area
Average Home Value in this Area
Purchase History
| Date | Buyer | Sale Price | Title Company |
|---|---|---|---|
| Pate Kathleen A | -- | Attorney | |
| Pate Kathleen | $142,000 | Title First | |
| Tincher John D | $119,500 | Connor Title Co |
Source: Public Records
Mortgage History
| Date | Status | Borrower | Loan Amount |
|---|---|---|---|
| Previous Owner | Tincher John D | $95,600 |
Source: Public Records
Tax History
| Year | Tax Paid | Tax Assessment Tax Assessment Total Assessment is a certain percentage of the fair market value that is determined by local assessors to be the total taxable value of land and additions on the property. | Land | Improvement |
|---|---|---|---|---|
| 2025 | $3,410 | $75,990 | $18,130 | $57,860 |
| 2024 | $3,410 | $75,990 | $18,130 | $57,860 |
| 2023 | $3,367 | $75,985 | $18,130 | $57,855 |
| 2022 | $2,816 | $54,290 | $11,550 | $42,740 |
| 2021 | $2,821 | $54,290 | $11,550 | $42,740 |
| 2020 | $2,824 | $54,290 | $11,550 | $42,740 |
| 2019 | $2,372 | $39,100 | $8,580 | $30,520 |
| 2018 | $2,276 | $39,100 | $8,580 | $30,520 |
| 2017 | $2,371 | $39,100 | $8,580 | $30,520 |
| 2016 | $2,407 | $36,330 | $8,050 | $28,280 |
| 2015 | $2,185 | $36,330 | $8,050 | $28,280 |
| 2014 | $2,190 | $36,330 | $8,050 | $28,280 |
| 2013 | $1,138 | $38,255 | $8,470 | $29,785 |
Source: Public Records
Map
Nearby Homes
- 1638 Arrowood Loop N
- 1862 Torchwood Dr
- 5352 Hazelwood Rd
- 1687 Brookfield Square S
- 5524 Driftwood Rd
- 5513 Redwood Rd
- 1452 Ironwood Dr
- 5705 Pine Tree St S Unit F
- 5092 Riverbirch Dr N
- 1523 Hempwood Dr
- 1439 Firwood Dr
- 2087 Teakwood Dr
- 2027 Shawbury Ct W
- 5801 Thada Ln
- 5726 Beechcroft Rd Unit J
- 5720 Beechcroft Rd Unit B
- 5732 Beechcroft Rd Unit B
- 5603 Maple Canyon Ave
- 5004 Julie Place
- 5479 Rockwood Rd
- 5413 Pine Bluff Rd
- 5395 Pine Bluff Rd
- 5410 Blue Ash Rd
- 5421 Pine Bluff Rd
- 5420 Blue Ash Rd
- 5383 Pine Bluff Rd
- 5402 Pine Bluff Rd
- 5428 Blue Ash Rd
- 5408 Pine Bluff Rd
- 5398 Pine Bluff Rd
- 5429 Pine Bluff Rd
- 5416 Pine Bluff Rd
- 5386 Pine Bluff Rd
- 5382 Pine Bluff Rd
- 5436 Blue Ash Rd
- 5390 Pine Bluff Rd
- 5424 Pine Bluff Rd
- 5394 Pine Bluff Rd
- 5378 Blue Ash Rd
- 5439 Pine Bluff Rd
Your Personal Tour Guide
Ask me questions while you tour the home.