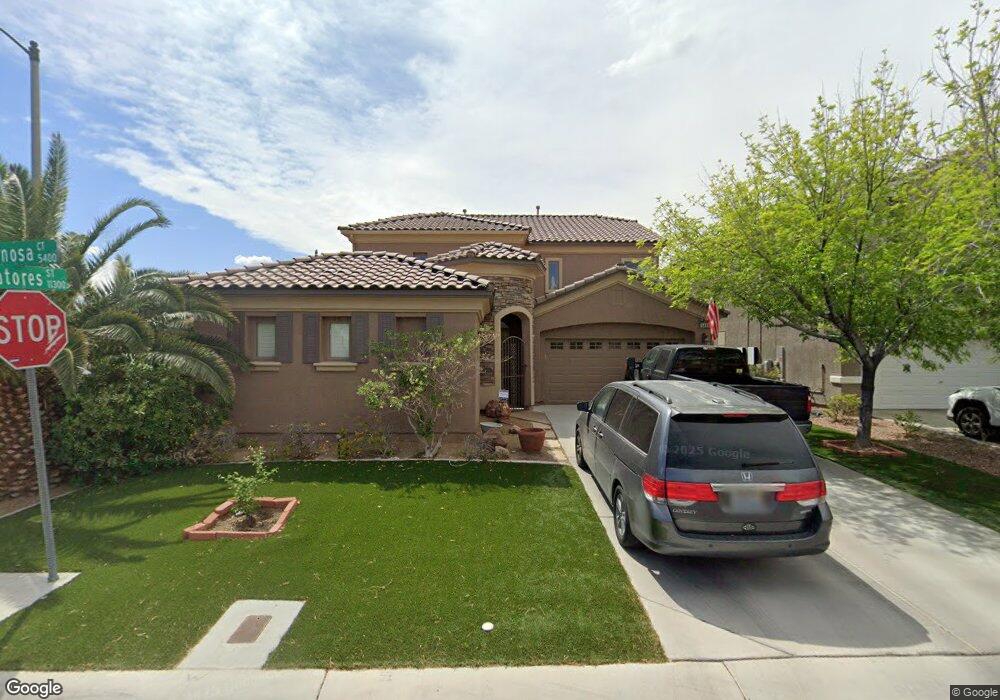
5405 Pinosa Ct Las Vegas, NV 89141
Southern Highlands NeighborhoodEstimated Value: $639,927 - $743,000
3
Beds
3
Baths
2,645
Sq Ft
$262/Sq Ft
Est. Value
About This Home
This home is located at 5405 Pinosa Ct, Las Vegas, NV 89141 and is currently estimated at $692,982, approximately $261 per square foot. 5405 Pinosa Ct is a home located in Clark County with nearby schools including Charles & Phyllis Frias Elementary School, Lois & Jerry Tarkanian Middle School, and Desert Oasis High School.
Ownership History
Date
Name
Owned For
Owner Type
Purchase Details
Closed on
Jan 9, 2025
Sold by
Tarder Gerald L
Bought by
Tarder Gerald L and Tarder Sergei
Current Estimated Value
Purchase Details
Closed on
Jan 9, 2009
Sold by
Ruth David R and Ruh Danell A
Bought by
Tarder Gerald L and Tarder Esme
Home Financials for this Owner
Home Financials are based on the most recent Mortgage that was taken out on this home.
Original Mortgage
$249,600
Interest Rate
5.97%
Mortgage Type
Unknown
Purchase Details
Closed on
Aug 28, 2003
Sold by
Beazer Homes Holdings Corp
Bought by
Ruh David R and Ruh Danell A
Home Financials for this Owner
Home Financials are based on the most recent Mortgage that was taken out on this home.
Original Mortgage
$240,700
Interest Rate
5.85%
Mortgage Type
Unknown
Create a Home Valuation Report for This Property
The Home Valuation Report is an in-depth analysis detailing your home's value as well as a comparison with similar homes in the area
Home Values in the Area
Average Home Value in this Area
Purchase History
| Date | Buyer | Sale Price | Title Company |
|---|---|---|---|
| Tarder Gerald L | -- | None Listed On Document | |
| Tarder Gerald L | $312,000 | Fidelity National Title Las | |
| Ruh David R | $300,895 | Lawyers Title Of Nevada |
Source: Public Records
Mortgage History
| Date | Status | Borrower | Loan Amount |
|---|---|---|---|
| Previous Owner | Tarder Gerald L | $249,600 | |
| Previous Owner | Ruh David R | $240,700 | |
| Closed | Ruh David R | $60,195 |
Source: Public Records
Tax History Compared to Growth
Tax History
| Year | Tax Paid | Tax Assessment Tax Assessment Total Assessment is a certain percentage of the fair market value that is determined by local assessors to be the total taxable value of land and additions on the property. | Land | Improvement |
|---|---|---|---|---|
| 2025 | $3,078 | $179,303 | $57,050 | $122,253 |
| 2024 | $2,851 | $179,303 | $57,050 | $122,253 |
| 2023 | $2,851 | $160,920 | $45,500 | $115,420 |
| 2022 | $2,646 | $151,398 | $45,500 | $105,898 |
| 2021 | $2,444 | $130,273 | $29,750 | $100,523 |
| 2020 | $2,267 | $129,255 | $29,750 | $99,505 |
| 2019 | $2,124 | $127,580 | $29,750 | $97,830 |
| 2018 | $2,027 | $119,078 | $25,200 | $93,878 |
| 2017 | $3,491 | $119,000 | $23,800 | $95,200 |
| 2016 | $1,898 | $108,599 | $17,500 | $91,099 |
| 2015 | $1,892 | $84,573 | $14,700 | $69,873 |
| 2014 | $1,834 | $60,681 | $10,500 | $50,181 |
Source: Public Records
Map
Nearby Homes
- 11334 Patores St
- 0 Starr Hills Ave Unit 2535931
- 5567 Cortu Ave
- 11152 Montagne Marron Blvd
- 11145 Montagne Marron Blvd
- 5672 Bracana Ct
- 5055 Quiet Falls Ct
- 11226 Star Lily St
- 5100 Ivy Creek Ct
- 5018 Quiet Falls Ct
- 11148 Star Lily St
- 11022 Saint Rafael St
- 5907 Ancona Dr
- 5909 Candia Ct
- 11024 Vallerosa St
- 2 Shadow Canyon Ct
- 5966 Candia Ct
- 5914 Tinazzi Way
- 11063 Gagliano St
- 11218 Dolcetto Dr
- 5411 Pinosa Ct
- 5417 Pinosa Ct
- 11398 Patores St
- 11390 Patores St
- 11382 Patores St
- 5404 Pinosa Ct
- 5410 Pinosa Ct
- 11374 Patores St
- 5416 Pinosa Ct
- 11366 Patores St
- 11358 Patores St
- 5403 Molise Ct
- 5409 Molise Ct
- 5415 Molise Ct
- 11350 Patores St
- 5402 Molise Ct
- 5408 Molise Ct
- 11326 Patores St
- 5414 Molise Ct
- 11318 Patores St