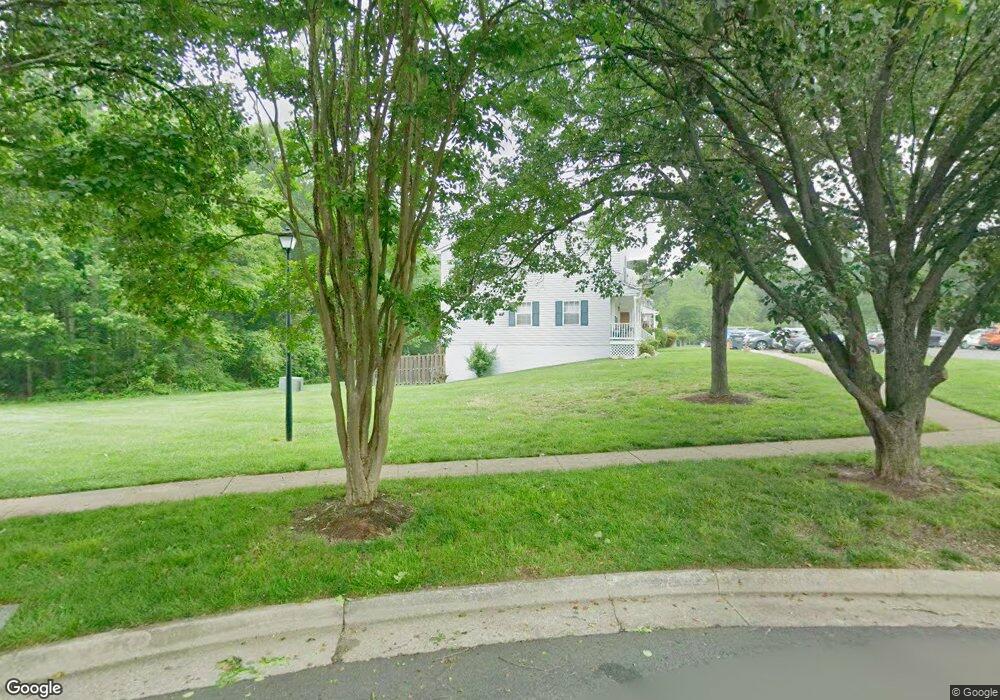
5405 Quarles Ct Woodbridge, VA 22193
Queensdale NeighborhoodEstimated Value: $415,000 - $429,280
3
Beds
2
Baths
1,268
Sq Ft
$331/Sq Ft
Est. Value
About This Home
This home is located at 5405 Quarles Ct, Woodbridge, VA 22193 and is currently estimated at $419,570, approximately $330 per square foot. 5405 Quarles Ct is a home located in Prince William County with nearby schools including C.D. Hylton High School, Martin Luther King Jr. Elementary School, and Stuart M. Beville Middle School.
Ownership History
Date
Name
Owned For
Owner Type
Purchase Details
Closed on
May 7, 2021
Sold by
Arnold Eric and Arnold Lorraine Legare
Bought by
Arnold Lorraine Legare and Arnold Eric
Current Estimated Value
Home Financials for this Owner
Home Financials are based on the most recent Mortgage that was taken out on this home.
Original Mortgage
$239,200
Outstanding Balance
$216,436
Interest Rate
3%
Mortgage Type
VA
Estimated Equity
$203,134
Purchase Details
Closed on
Oct 17, 2019
Sold by
Arnold Eric
Bought by
Arnold Eric and Arnold Lorraine Legare
Home Financials for this Owner
Home Financials are based on the most recent Mortgage that was taken out on this home.
Original Mortgage
$242,250
Interest Rate
3.5%
Mortgage Type
New Conventional
Purchase Details
Closed on
Mar 14, 2007
Sold by
Pepper Geraldine P
Bought by
Arnold Eric
Home Financials for this Owner
Home Financials are based on the most recent Mortgage that was taken out on this home.
Original Mortgage
$299,900
Interest Rate
6.4%
Mortgage Type
New Conventional
Create a Home Valuation Report for This Property
The Home Valuation Report is an in-depth analysis detailing your home's value as well as a comparison with similar homes in the area
Home Values in the Area
Average Home Value in this Area
Purchase History
| Date | Buyer | Sale Price | Title Company |
|---|---|---|---|
| Arnold Lorraine Legare | -- | Walker Title Llc | |
| Arnold Eric | -- | None Available | |
| Arnold Eric | $299,900 | -- |
Source: Public Records
Mortgage History
| Date | Status | Borrower | Loan Amount |
|---|---|---|---|
| Open | Arnold Lorraine Legare | $239,200 | |
| Closed | Arnold Eric | $242,250 | |
| Closed | Arnold Eric | $299,900 |
Source: Public Records
Tax History Compared to Growth
Tax History
| Year | Tax Paid | Tax Assessment Tax Assessment Total Assessment is a certain percentage of the fair market value that is determined by local assessors to be the total taxable value of land and additions on the property. | Land | Improvement |
|---|---|---|---|---|
| 2025 | $3,509 | $377,600 | $112,400 | $265,200 |
| 2024 | $3,509 | $352,800 | $105,100 | $247,700 |
| 2023 | $3,393 | $326,100 | $96,400 | $229,700 |
| 2022 | $3,489 | $306,400 | $90,100 | $216,300 |
| 2021 | $3,309 | $268,600 | $78,300 | $190,300 |
| 2020 | $4,055 | $261,600 | $74,000 | $187,600 |
| 2019 | $3,773 | $243,400 | $72,000 | $171,400 |
| 2018 | $2,733 | $226,300 | $76,800 | $149,500 |
| 2017 | $2,986 | $239,800 | $82,000 | $157,800 |
| 2016 | $2,693 | $217,600 | $80,200 | $137,400 |
| 2015 | $2,574 | $218,600 | $80,200 | $138,400 |
| 2014 | $2,574 | $203,300 | $72,800 | $130,500 |
Source: Public Records
Map
Nearby Homes
- 5207 Quiet Place
- 13441 Kerr Ct
- 5308 Macwood Dr
- 13217 Nickleson Dr
- 5534 Victory Loop
- 13732 Moccasin Ct
- 5020 Quinlan Dr
- 13737 Moccasin Ct
- 14119 Baneberry Cir
- 13501 Photo Dr
- 13101 Kurtz Rd
- 13201 Quate Ln
- 5154 Meeting Place
- 5005 Quiller Ct
- 13454 Princedale Dr
- 12911 Hyannis Ln
- 12849 Hoadly Manor Dr
- 5660 Hoadly Rd
- 13025 Pilgrims Inn Dr
- 4903 Kenyon Ct
- 5403 Quarles Ct
- 5407 Quarles Ct
- 5409 Quarles Ct
- 5401 Quarles Ct
- 5411 Quarles Ct
- 5413 Quarles Ct
- 5415 Quarles Ct
- 5417 Quarles Ct
- 5419 Quarles Ct
- 5404 Quarles Ct
- 5406 Quarles Ct
- 5402 Quarles Ct
- 5410 Quarles Ct
- 5412 Quarles Ct
- 5414 Quarles Ct
- 5416 Quarles Ct
- 5418 Quarles Ct
- 5420 Quarles Ct
- 13102 Quann Ln
- 5417 Quest Ct