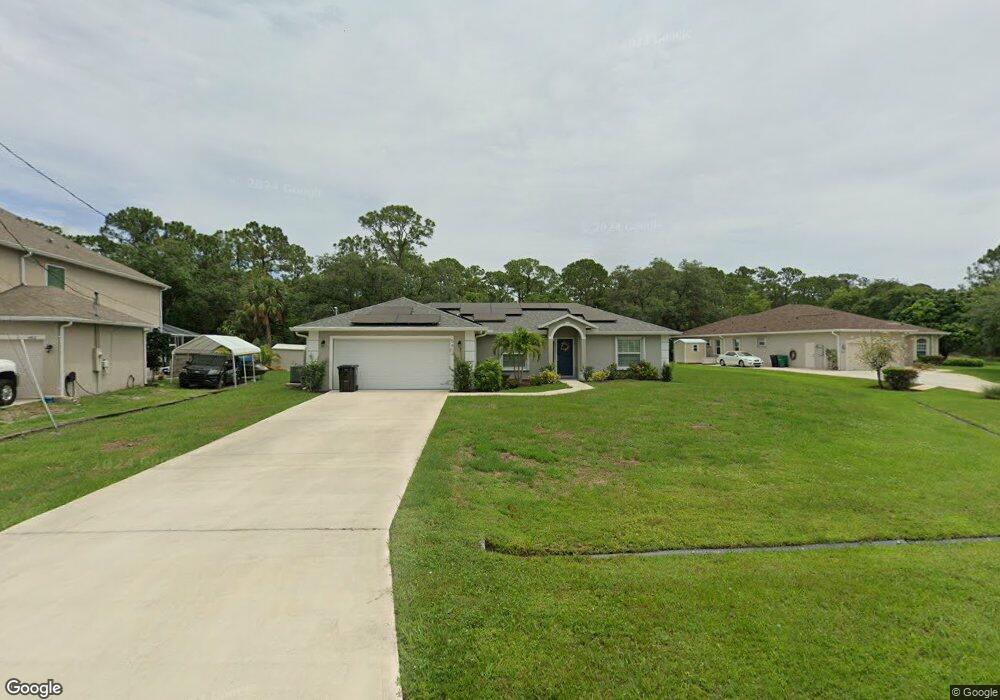
5406 NW Thyer Cir Port Saint Lucie, FL 34983
Saint Lucie North NeighborhoodEstimated Value: $400,916 - $441,000
3
Beds
2
Baths
1,511
Sq Ft
$278/Sq Ft
Est. Value
About This Home
This home is located at 5406 NW Thyer Cir, Port Saint Lucie, FL 34983 and is currently estimated at $420,229, approximately $278 per square foot. 5406 NW Thyer Cir is a home with nearby schools including Parkway Elementary School, Northport K-8 School, and Floresta Elementary School.
Ownership History
Date
Name
Owned For
Owner Type
Purchase Details
Closed on
Oct 28, 2021
Sold by
Coral Buuders Llc
Bought by
Dela Barrera Franklyn and De La Barrera
Current Estimated Value
Home Financials for this Owner
Home Financials are based on the most recent Mortgage that was taken out on this home.
Original Mortgage
$345,000
Outstanding Balance
$315,290
Interest Rate
2.8%
Mortgage Type
New Conventional
Estimated Equity
$104,939
Purchase Details
Closed on
Jan 29, 2021
Sold by
Richardson Nola H and Richardson Michael D
Bought by
Coral Builders Llc
Purchase Details
Closed on
May 12, 2011
Sold by
Hazelton Lyman R
Bought by
Richardson Nola H and Richardson Michael D
Purchase Details
Closed on
May 15, 2008
Sold by
Grazi Denise
Bought by
Richardson Nola H and Richardson Michael D
Purchase Details
Closed on
Oct 15, 2002
Sold by
Dana Joseph and Dana Sally
Bought by
Dana Morris
Create a Home Valuation Report for This Property
The Home Valuation Report is an in-depth analysis detailing your home's value as well as a comparison with similar homes in the area
Home Values in the Area
Average Home Value in this Area
Purchase History
| Date | Buyer | Sale Price | Title Company |
|---|---|---|---|
| Dela Barrera Franklyn | $375,000 | First International Ttl Inc | |
| Coral Builders Llc | $52,000 | First International Ttl Inc | |
| Richardson Nola H | -- | None Available | |
| Richardson Nola H | $65,000 | Fast Title Inc | |
| Dana Morris | -- | -- |
Source: Public Records
Mortgage History
| Date | Status | Borrower | Loan Amount |
|---|---|---|---|
| Open | Dela Barrera Franklyn | $345,000 |
Source: Public Records
Tax History Compared to Growth
Tax History
| Year | Tax Paid | Tax Assessment Tax Assessment Total Assessment is a certain percentage of the fair market value that is determined by local assessors to be the total taxable value of land and additions on the property. | Land | Improvement |
|---|---|---|---|---|
| 2024 | $2,362 | $128,710 | -- | -- |
| 2023 | $2,362 | $124,962 | $0 | $0 |
| 2022 | $2,235 | $121,323 | $0 | $0 |
| 2021 | $863 | $45,200 | $45,200 | $0 |
| 2020 | $764 | $34,500 | $34,500 | $0 |
| 2019 | $741 | $34,700 | $34,700 | $0 |
| 2018 | $643 | $28,200 | $28,200 | $0 |
| 2017 | $600 | $25,000 | $25,000 | $0 |
| 2016 | $547 | $20,900 | $20,900 | $0 |
| 2015 | $503 | $17,500 | $17,500 | $0 |
| 2014 | $440 | $12,760 | $0 | $0 |
Source: Public Records
Map
Nearby Homes
- 6209 NW Duke Cir
- 5515 NW Dunn Rd
- 5475 NW Scepter Dr
- 2790 Rainbow Dr
- 5303 NW Nassau Ln
- 2590 Rainbow Dr
- 6305 NW Hala Ct
- 5422 Stately Oaks St
- 5180 NW Newark Ln
- 2401 River Branch Dr
- 2411 Noble Oaks Ln
- 6145 NW Helmsdale Way
- 5145 Turtle Creek Place
- 6179 NW Helmsdale Way
- 6575 NW Pomona Ct
- 5423 NW Milner Dr
- 6244 NW Helmsdale Way
- 6565 NW Pomona Ct
- 2420 Noble Oaks Ln
- 2400 Noble Oaks Ln
- 6018 NW Huey Ct
- 5412 NW Thyer Cir
- 5418 NW Thyer Cir
- 6003 NW Huey Ct
- 5413 NW Thyer Cir
- 5419 NW Thyer Cir
- 5405 NW Thyer Cir
- 6129 NW Snook Ct
- 5394 NW Thyer Cir
- 5432 NW Thyer Cir
- 5471 NW Thyer Cir
- 5388 NW Thyer Cir
- 5385 Christensen Rd
- 6088 NW Relief Ct
- 6116 NW Snook Ct
- 6080 NW Relief Ct
- 5394 Winthrop Dr
- 5391 Winthrop Dr
- 6093 NW Relief Ct
- 5479 NW Thyer Cir