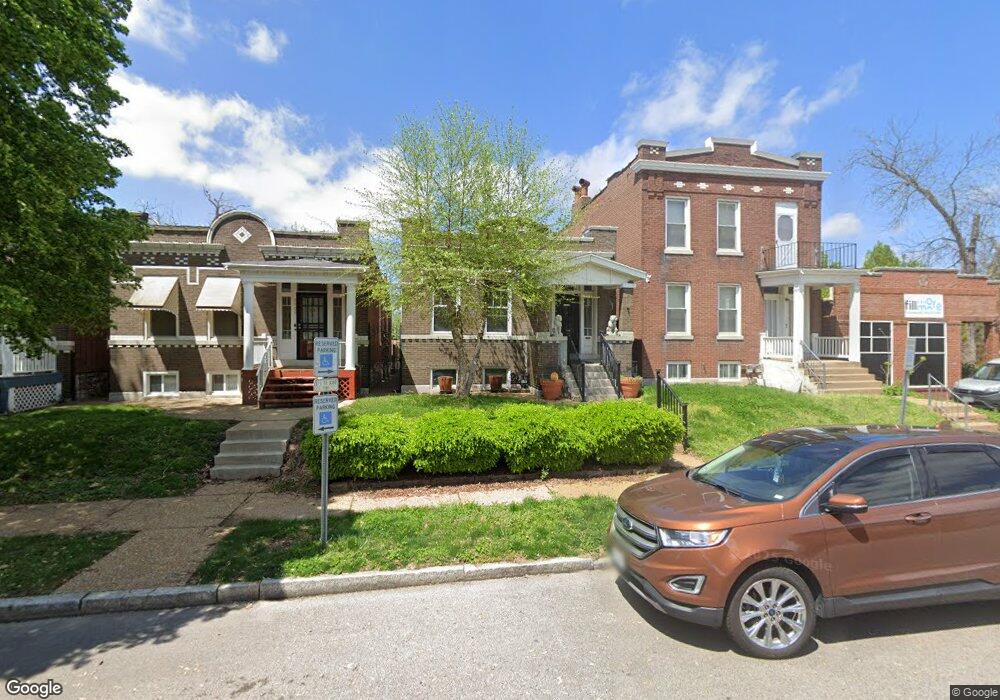
5407 Alabama Ave Saint Louis, MO 63111
Carondelet NeighborhoodEstimated Value: $119,000 - $138,972
2
Beds
2
Baths
1,173
Sq Ft
$110/Sq Ft
Est. Value
About This Home
This home is located at 5407 Alabama Ave, Saint Louis, MO 63111 and is currently estimated at $128,743, approximately $109 per square foot. 5407 Alabama Ave is a home located in St. Louis City with nearby schools including Woodward Elementary School, Lyon at Blow Elementary School, and Roosevelt High School.
Ownership History
Date
Name
Owned For
Owner Type
Purchase Details
Closed on
Jul 31, 2025
Sold by
Elgin Andre and Elgin Tammy
Bought by
Elgin Tammy
Current Estimated Value
Purchase Details
Closed on
Jun 27, 2025
Sold by
Elgin Andre and Elgin Tammy
Bought by
Elgin Andre and Elgin Tammy
Purchase Details
Closed on
Sep 15, 2011
Sold by
Grass Brian and Grass Rebecca
Bought by
Elgin Andre
Home Financials for this Owner
Home Financials are based on the most recent Mortgage that was taken out on this home.
Original Mortgage
$71,344
Interest Rate
4.34%
Mortgage Type
FHA
Purchase Details
Closed on
Jun 22, 2007
Sold by
Sheridan Mary E
Bought by
Grass Brian and Grass Rebecca
Home Financials for this Owner
Home Financials are based on the most recent Mortgage that was taken out on this home.
Original Mortgage
$93,500
Interest Rate
6.37%
Mortgage Type
Purchase Money Mortgage
Purchase Details
Closed on
Dec 22, 2004
Sold by
Blackwell Evelyn Dolores and Blackwell Milford J
Bought by
Sheridan Mary E
Create a Home Valuation Report for This Property
The Home Valuation Report is an in-depth analysis detailing your home's value as well as a comparison with similar homes in the area
Home Values in the Area
Average Home Value in this Area
Purchase History
| Date | Buyer | Sale Price | Title Company |
|---|---|---|---|
| Elgin Tammy | -- | Title365 | |
| Elgin Andre | -- | None Listed On Document | |
| Elgin Andre | -- | None Available | |
| Grass Brian | -- | None Available | |
| Sheridan Mary E | -- | -- |
Source: Public Records
Mortgage History
| Date | Status | Borrower | Loan Amount |
|---|---|---|---|
| Previous Owner | Elgin Andre | $71,344 | |
| Previous Owner | Grass Brian | $93,500 |
Source: Public Records
Tax History Compared to Growth
Tax History
| Year | Tax Paid | Tax Assessment Tax Assessment Total Assessment is a certain percentage of the fair market value that is determined by local assessors to be the total taxable value of land and additions on the property. | Land | Improvement |
|---|---|---|---|---|
| 2025 | $953 | $13,850 | $1,030 | $12,820 |
| 2024 | $908 | $11,050 | $1,030 | $10,020 |
| 2023 | $908 | $11,050 | $1,030 | $10,020 |
| 2022 | $859 | $10,050 | $1,030 | $9,020 |
| 2021 | $858 | $10,050 | $1,030 | $9,020 |
| 2020 | $809 | $9,540 | $1,030 | $8,510 |
| 2019 | $807 | $9,540 | $1,030 | $8,510 |
| 2018 | $757 | $8,670 | $1,030 | $7,640 |
| 2017 | $745 | $8,660 | $1,030 | $7,640 |
| 2016 | $941 | $10,890 | $1,030 | $9,860 |
| 2015 | $855 | $10,890 | $1,030 | $9,860 |
| 2014 | $922 | $10,890 | $1,030 | $9,860 |
| 2013 | -- | $11,780 | $1,030 | $10,750 |
Source: Public Records
Map
Nearby Homes
- 5401 Idaho Ave
- 5240 Louisiana Ave
- 5507 Vermont Ave
- 5228 Vermont Ave
- 5224 Louisiana Ave
- 5518 Louisiana Ave
- 5044 Louisiana Ave
- 5042 Louisiana Ave
- 929 Bellerive Blvd
- 617 Bellerive Blvd
- 5418 Virginia Ave
- 5507 Virginia Ave
- 5512 Virginia Ave Unit 1,2,3,4
- 5000 Virginia Ave
- 5216 S Compton Ave
- 4741 Idaho Ave
- 5123 Wicklow Place
- 5206 S Grand Blvd
- 5528 S Grand Blvd
- 1108 Bates St
- 5409 Alabama Ave
- 5405 Alabama Ave
- 5415 Alabama Ave
- 5401 Alabama Ave
- 5417 Alabama Ave
- 5421 Alabama Ave
- 565 Eiler St
- 5410 Idaho Ave
- 5406 Idaho Ave
- 5406 Idaho Ave
- 5241 Alabama Ave
- 5412 Idaho Ave
- 5404 Idaho Ave
- 5416 Idaho Ave
- 564 Eiler St
- 5402 Idaho Ave
- 561 Eiler St
- 5418 Idaho Ave
- 5237 Alabama Ave
- 562 Eiler St