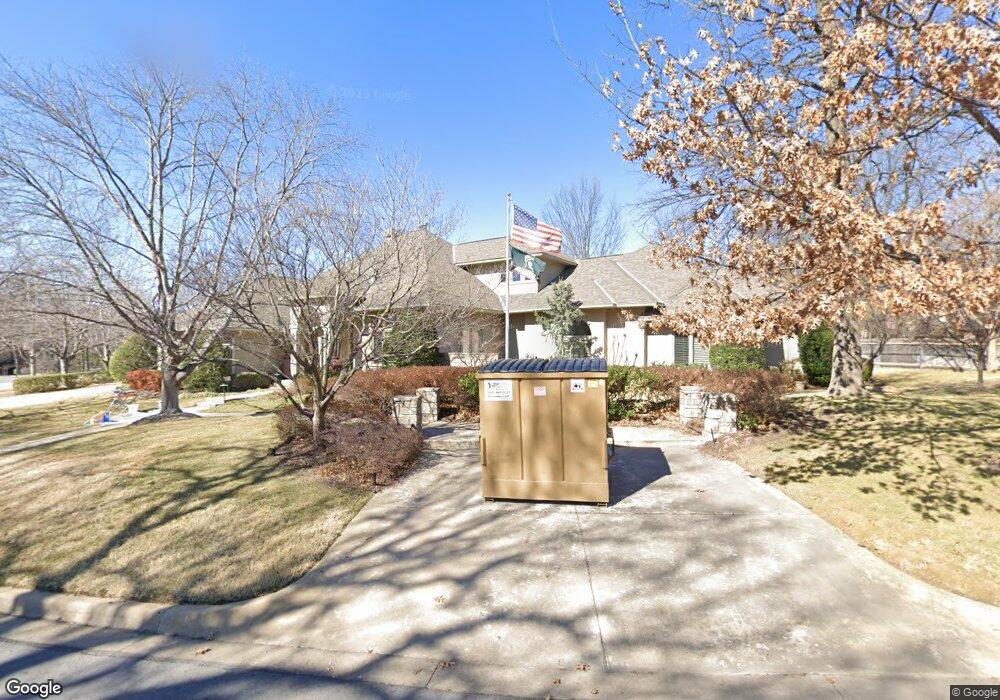
5407 E 118th St Tulsa, OK 74137
Knollwood Estates NeighborhoodEstimated Value: $717,064 - $889,000
Studio
3
Baths
4,095
Sq Ft
$195/Sq Ft
Est. Value
About This Home
This home is located at 5407 E 118th St, Tulsa, OK 74137 and is currently estimated at $799,266, approximately $195 per square foot. 5407 E 118th St is a home located in Tulsa County with nearby schools including Bixby North Elementary, Bixby North Intermediate, and Bixby Middle School.
Ownership History
Date
Name
Owned For
Owner Type
Purchase Details
Closed on
Jan 30, 2013
Sold by
Denslow Gary T and Denslow Lorma Lee
Bought by
Denslow Gary T and Denslow Lorma Lee
Current Estimated Value
Purchase Details
Closed on
Jul 30, 2010
Sold by
Denslow Lorma L and Denslow Gary T
Bought by
Denslow Gary T and Denslow Lorma L
Home Financials for this Owner
Home Financials are based on the most recent Mortgage that was taken out on this home.
Original Mortgage
$213,500
Interest Rate
4.69%
Mortgage Type
New Conventional
Purchase Details
Closed on
Oct 10, 2001
Sold by
Denslow Gary T and Denslow Lorma L
Bought by
Denslow Lorma L
Purchase Details
Closed on
Mar 18, 1999
Sold by
Murphy Resources Inc
Bought by
Denslow Gary T and Denslow Lorma L
Purchase Details
Closed on
Jan 29, 1998
Sold by
Forest Hills Land Company L L C
Bought by
Murphy Resources Inc
Home Financials for this Owner
Home Financials are based on the most recent Mortgage that was taken out on this home.
Original Mortgage
$75,600
Interest Rate
6.98%
Mortgage Type
Purchase Money Mortgage
Create a Home Valuation Report for This Property
The Home Valuation Report is an in-depth analysis detailing your home's value as well as a comparison with similar homes in the area
Home Values in the Area
Average Home Value in this Area
Purchase History
| Date | Buyer | Sale Price | Title Company |
|---|---|---|---|
| Denslow Gary T | -- | None Available | |
| Denslow Gary T | -- | None Available | |
| Denslow Lorma L | -- | -- | |
| Denslow Gary T | $110,000 | -- | |
| Murphy Resources Inc | $94,500 | -- |
Source: Public Records
Mortgage History
| Date | Status | Borrower | Loan Amount |
|---|---|---|---|
| Closed | Denslow Gary T | $213,500 | |
| Previous Owner | Murphy Resources Inc | $75,600 |
Source: Public Records
Tax History
| Year | Tax Paid | Tax Assessment Tax Assessment Total Assessment is a certain percentage of the fair market value that is determined by local assessors to be the total taxable value of land and additions on the property. | Land | Improvement |
|---|---|---|---|---|
| 2025 | $9,520 | $68,576 | $12,517 | $56,059 |
| 2024 | $8,613 | $66,549 | $13,804 | $52,745 |
| 2023 | $8,613 | $65,581 | $13,901 | $51,680 |
| 2022 | $8,691 | $62,671 | $15,158 | $47,513 |
| 2021 | $8,709 | $62,671 | $15,158 | $47,513 |
| 2020 | $8,572 | $62,671 | $15,158 | $47,513 |
| 2019 | $8,687 | $61,315 | $14,830 | $46,485 |
| 2018 | $8,401 | $59,500 | $14,323 | $45,177 |
| 2017 | $8,325 | $60,500 | $14,564 | $45,936 |
| 2016 | $8,276 | $60,500 | $14,564 | $60,841 |
| 2015 | $9,961 | $75,405 | $14,564 | $60,841 |
| 2014 | $9,821 | $75,405 | $14,564 | $60,841 |
Source: Public Records
Map
Nearby Homes
- 5509 E 118th St
- 5630 E 117th Place
- 11616 S Hudson Ct
- 11938 S Canton Ave
- 11908 S Allegheny Ave
- 11503 S Granite Ave
- 11475 S Yale Ave
- 6003 E 117th Place
- 4949 E 114th Place
- 12011 S Vandalia Ave
- 11803 S Kingston Ave
- 11922 S Kingston Ave
- 11915 S Vandalia Ave
- 11927 S Vandalia Ave
- 4610 E 118th St
- 11909 S Vandalia Ave
- 12036 S Vandalia Ave
- 6037 E 119th Place
- 12005 S Vandalia Ave
- 12029 S Vandalia Ave
- 11716 S Fulton Ave
- 11710 S Fulton Ave
- 5412 E 118th St
- 5406 E 118th St
- 5416 E 118th St
- 11704 S Fulton Ave
- 11728 S Erie Ave
- 5420 E 118th St
- 5402 E 118th St
- 11732 S Erie Ave
- 11718 S Erie Ave
- 11712 S Erie Ave
- 5417 E 119th St
- 11715 S Fulton Ave
- 11711 S Fulton Ave
- 5423 E 119th St
- 11708 S Erie Ave
- 11706 S Erie Ave
- 11707 S Fulton Ave
- 11906 S Erie Ave
Your Personal Tour Guide
Ask me questions while you tour the home.