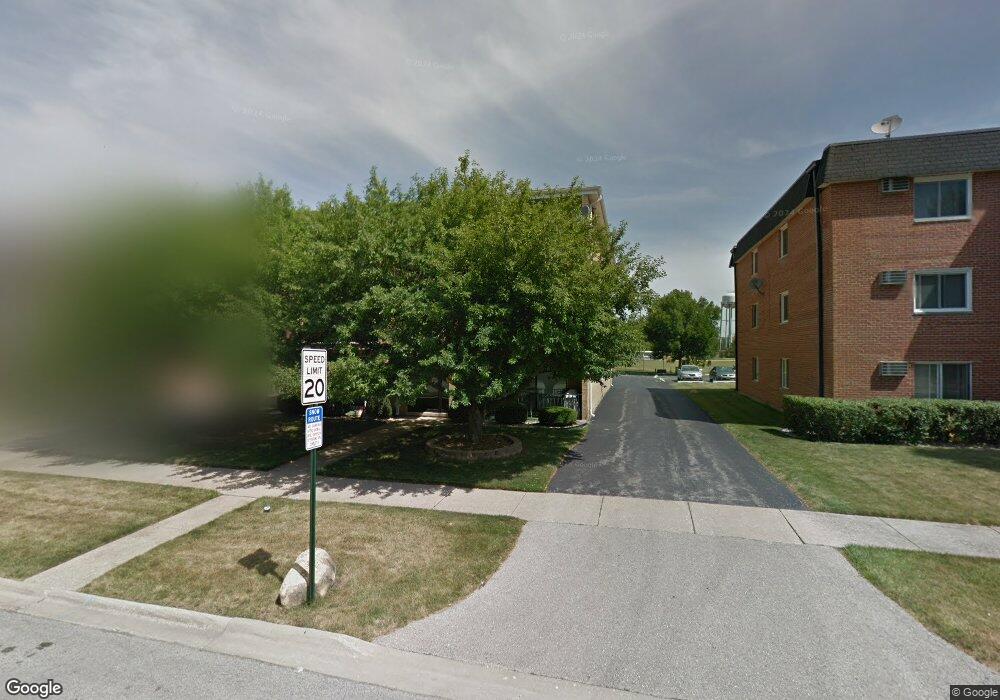
5408 129th Place Unit 2206 Crestwood, IL 60445
Estimated Value: $154,000 - $170,000
2
Beds
1
Bath
800
Sq Ft
$200/Sq Ft
Est. Value
About This Home
This home is located at 5408 129th Place Unit 2206, Crestwood, IL 60445 and is currently estimated at $159,981, approximately $199 per square foot. 5408 129th Place Unit 2206 is a home located in Cook County with nearby schools including Nathan Hale Primary School, Nathan Hale Intermediate School, and Nathan Hale Middle School.
Ownership History
Date
Name
Owned For
Owner Type
Purchase Details
Closed on
May 13, 2024
Sold by
Curtis Eric L
Bought by
Wall John
Current Estimated Value
Purchase Details
Closed on
Sep 26, 2003
Sold by
Davis Tanesha N and Taylor Tanesha N
Bought by
Curtis Eric L
Home Financials for this Owner
Home Financials are based on the most recent Mortgage that was taken out on this home.
Original Mortgage
$98,800
Interest Rate
6.4%
Mortgage Type
Unknown
Purchase Details
Closed on
Mar 22, 1999
Sold by
Krebs Joseph E and Krebs Steven
Bought by
Davis Tanesha N
Home Financials for this Owner
Home Financials are based on the most recent Mortgage that was taken out on this home.
Original Mortgage
$71,250
Interest Rate
6.87%
Purchase Details
Closed on
Dec 14, 1998
Sold by
Krebs Joseph E
Bought by
Krebs Joseph E and Krebs Steven
Create a Home Valuation Report for This Property
The Home Valuation Report is an in-depth analysis detailing your home's value as well as a comparison with similar homes in the area
Home Values in the Area
Average Home Value in this Area
Purchase History
| Date | Buyer | Sale Price | Title Company |
|---|---|---|---|
| Wall John | $152,000 | Chicago Title | |
| Curtis Eric L | $104,000 | -- | |
| Davis Tanesha N | $75,000 | Burnett Title Llc | |
| Krebs Joseph E | -- | -- |
Source: Public Records
Mortgage History
| Date | Status | Borrower | Loan Amount |
|---|---|---|---|
| Previous Owner | Curtis Eric L | $98,800 | |
| Previous Owner | Davis Tanesha N | $71,250 |
Source: Public Records
Tax History Compared to Growth
Tax History
| Year | Tax Paid | Tax Assessment Tax Assessment Total Assessment is a certain percentage of the fair market value that is determined by local assessors to be the total taxable value of land and additions on the property. | Land | Improvement |
|---|---|---|---|---|
| 2024 | $2,145 | $10,490 | $1,085 | $9,405 |
| 2023 | $1,632 | $10,490 | $1,085 | $9,405 |
| 2022 | $1,632 | $7,980 | $613 | $7,367 |
| 2021 | $1,574 | $7,980 | $613 | $7,367 |
| 2020 | $1,623 | $7,980 | $613 | $7,367 |
| 2019 | $1,403 | $7,564 | $566 | $6,998 |
| 2018 | $1,343 | $7,564 | $566 | $6,998 |
| 2017 | $1,406 | $7,564 | $566 | $6,998 |
| 2016 | $1,351 | $6,352 | $471 | $5,881 |
| 2015 | $1,286 | $6,352 | $471 | $5,881 |
| 2014 | $1,277 | $6,352 | $471 | $5,881 |
| 2013 | $1,641 | $7,941 | $471 | $7,470 |
Source: Public Records
Map
Nearby Homes
- 12828 Terrace Ln
- 12809 Carriage Ln Unit 9
- 5704 W 128th St Unit 1C
- 5723 129th St Unit 7E
- 5712 128th St Unit 1A
- 12750 Carriage Ln Unit F2
- 5715 Park Place Unit J2
- 5715 Park Place Unit K1
- 12720 Carriage Ln Unit B2
- 12620 S Alpine Dr Unit 6
- 12620 S Alpine Dr Unit 4
- 12620 S Alpine Dr Unit 8
- 12649 S Parkside Ave
- 13231 E Playfield Dr
- 12613 S Parkside Ave
- 5544 W Cal Sag Rd
- 5821 W 127th St
- 9208 S Monitor Ave
- 5400 135th St Unit 5406
- 5400 135th St Unit 5404
- 5408 129th Place Unit 2204
- 5408 129th Place Unit 2202
- 5408 129th Place Unit 2205
- 5408 129th Place Unit 2201
- 5408 129th Place Unit 2203
- 5408 129th Place Unit 1W
- 5408 129th Place Unit 3W
- 5408 129th Place Unit 2E
- 5408 129th Place Unit 2N
- 12850 Crestbrook Ct Unit 1
- 12850 Crestbrook Ct Unit 8
- 12850 Crestbrook Ct Unit 11
- 12850 Crestbrook Ct Unit 10
- 12850 Crestbrook Ct Unit 7
- 12850 Crestbrook Ct Unit 9
- 12850 Crestbrook Ct Unit 12
- 12850 Crestbrook Ct Unit 4
- 12850 Crestbrook Ct Unit 2
- 12850 Crestbrook Ct Unit 5
- 5416 W 129th Place