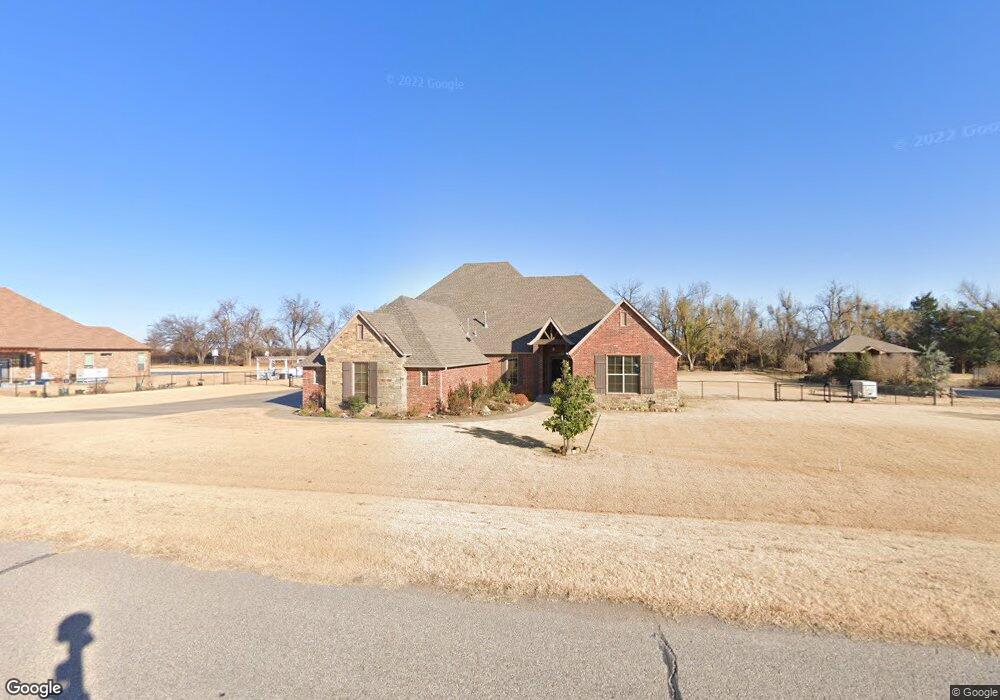
5408 Lazy Fawn Trail Mustang, OK 73064
Estimated Value: $566,000 - $886,000
4
Beds
3
Baths
3,659
Sq Ft
$185/Sq Ft
Est. Value
About This Home
This home is located at 5408 Lazy Fawn Trail, Mustang, OK 73064 and is currently estimated at $677,631, approximately $185 per square foot. 5408 Lazy Fawn Trail is a home with nearby schools including Mustang Centennial Elementary School, Mustang Horizon Intermediate School, and Mustang Middle School.
Ownership History
Date
Name
Owned For
Owner Type
Purchase Details
Closed on
Feb 25, 2015
Sold by
Hopeman Richard L and Hopeman Dolores C
Bought by
Hopeman Richard L and Richard L Hopeman Trust
Current Estimated Value
Purchase Details
Closed on
Apr 11, 2014
Sold by
Rj Designs Inc
Bought by
Hopeman Richard L and Hopeman Dolores C
Home Financials for this Owner
Home Financials are based on the most recent Mortgage that was taken out on this home.
Original Mortgage
$440,000
Outstanding Balance
$132,394
Interest Rate
4.34%
Mortgage Type
New Conventional
Estimated Equity
$545,237
Purchase Details
Closed on
May 10, 2013
Sold by
West Mustang Inc
Bought by
Rj Designs Inc
Home Financials for this Owner
Home Financials are based on the most recent Mortgage that was taken out on this home.
Original Mortgage
$288,000
Interest Rate
3.61%
Mortgage Type
Construction
Create a Home Valuation Report for This Property
The Home Valuation Report is an in-depth analysis detailing your home's value as well as a comparison with similar homes in the area
Home Values in the Area
Average Home Value in this Area
Purchase History
| Date | Buyer | Sale Price | Title Company |
|---|---|---|---|
| Hopeman Richard L | -- | None Available | |
| Hopeman Richard L | $440,000 | Fatco | |
| Rj Designs Inc | $40,000 | Ort |
Source: Public Records
Mortgage History
| Date | Status | Borrower | Loan Amount |
|---|---|---|---|
| Open | Hopeman Richard L | $440,000 | |
| Previous Owner | Rj Designs Inc | $288,000 |
Source: Public Records
Tax History Compared to Growth
Tax History
| Year | Tax Paid | Tax Assessment Tax Assessment Total Assessment is a certain percentage of the fair market value that is determined by local assessors to be the total taxable value of land and additions on the property. | Land | Improvement |
|---|---|---|---|---|
| 2024 | $6,201 | $57,434 | $6,240 | $51,194 |
| 2023 | $6,201 | $55,761 | $6,240 | $49,521 |
| 2022 | $6,108 | $54,137 | $6,240 | $47,897 |
| 2021 | $5,904 | $52,560 | $6,240 | $46,320 |
| 2020 | $5,787 | $51,029 | $6,240 | $44,789 |
| 2019 | $5,610 | $49,543 | $6,240 | $43,303 |
| 2018 | $5,544 | $48,100 | $7,200 | $40,900 |
| 2017 | $5,523 | $48,534 | $7,200 | $41,334 |
| 2016 | $5,646 | $49,723 | $7,200 | $42,523 |
| 2015 | -- | $48,281 | $4,800 | $43,481 |
| 2014 | -- | $532 | $532 | $0 |
Source: Public Records
Map
Nearby Homes
- 10413 SW 51st St
- 10325 SW 50th St
- 10440 SW 50th St
- 10420 SW 49th St
- 10400 SW 49th St
- 10412 SW 49th St
- 4821 Hidalgo Ave
- 5112 Misty Wood Ln
- 5017 Misty Wood Ln
- 5108 Misty Wood Ln
- 5104 Misty Wood Ln
- 5013 Misty Wood Ln
- 5008 Misty Wood Ln
- 4917 Misty Wood Ln
- 5004 Misty Wood Ln
- 5705 Tiger Stone Dr
- 4909 Misty Wood Ln
- 4908 Misty Wood Ln
- 4901 Vine Cliff Rd
- 11725 SW 48th St
- 5400 Lazy Fawn Trail
- 5416 Lazy Fawn Trail
- 1829 W Jj Court Way
- 1821 W Jj Court Way
- 1820 W Jj Court Way
- 12008 SW 53rd St
- 5417 Lazy Fawn Trail
- 5500 Lazy Fawn Trail
- 5501 Lazy Fawn Trail
- 12016 SW 53rd St
- 12001 SW 53rd St
- 12009 SW 53rd St
- 12017 SW 53rd St
- 5508 Lazy Fawn Trail
- 12100 SW 53rd St
- 12001 SW 56th St
- 12025 SW 53rd St
- 5508 Hidden Fawn Cir
- 12000 SW 56th St
- 12108 SW 53rd St