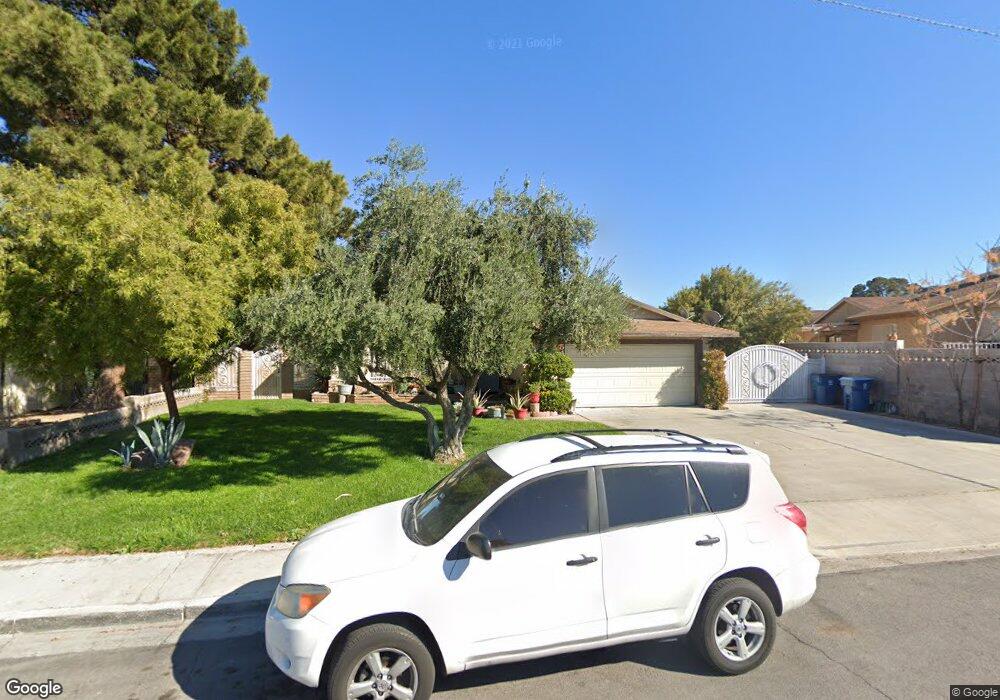
5408 Stirrup St Las Vegas, NV 89119
University District NeighborhoodEstimated Value: $328,506 - $390,000
3
Beds
2
Baths
1,224
Sq Ft
$295/Sq Ft
Est. Value
About This Home
This home is located at 5408 Stirrup St, Las Vegas, NV 89119 and is currently estimated at $360,627, approximately $294 per square foot. 5408 Stirrup St is a home located in Clark County with nearby schools including Jack Dailey Elementary School, Gene Ward Elementary School, and Helen C. Cannon Junior High School.
Ownership History
Date
Name
Owned For
Owner Type
Purchase Details
Closed on
Sep 17, 2025
Sold by
Palomino-Ramirez Maria A and Ramirez Maria Antonia
Bought by
Ramirez Maria Antonia Palo and Palomino Mayra Rodriguez
Current Estimated Value
Purchase Details
Closed on
Jan 17, 2020
Sold by
Rodriguez Mayra
Bought by
Palomino Ramirez Maria A
Purchase Details
Closed on
Sep 3, 2010
Sold by
Palomino Juan
Bought by
Palomino Ramirez Maria A and Rodriguez Mayra
Purchase Details
Closed on
Jan 26, 2010
Sold by
Weiss Nir Avrham
Bought by
Weiss Richard
Purchase Details
Closed on
Jan 13, 2010
Sold by
Weiss Richard and Rodriguez Mayra
Bought by
Palomino Juan
Purchase Details
Closed on
Dec 11, 2009
Sold by
Weiss Nir Avrham
Bought by
Weiss Richard
Purchase Details
Closed on
Nov 20, 2009
Sold by
Gorman Jo A
Bought by
Rodriguez Mayra and Weiss Richard
Purchase Details
Closed on
Jun 12, 2008
Sold by
Jawhari Dory El
Bought by
Gorman Jo A
Purchase Details
Closed on
Aug 8, 2007
Sold by
Gorman Jo A
Bought by
El Jawhari Dory
Home Financials for this Owner
Home Financials are based on the most recent Mortgage that was taken out on this home.
Original Mortgage
$240,000
Interest Rate
6.62%
Mortgage Type
Seller Take Back
Purchase Details
Closed on
Jan 25, 2005
Sold by
Barnes Dorothy L and Barnes Gregg M
Bought by
Gorman Jo A
Home Financials for this Owner
Home Financials are based on the most recent Mortgage that was taken out on this home.
Original Mortgage
$160,000
Interest Rate
5.67%
Mortgage Type
Credit Line Revolving
Purchase Details
Closed on
Nov 16, 2004
Sold by
Barnes Gregg M
Bought by
Barnes Gregg M and Barnes Dorothy L
Purchase Details
Closed on
Jun 11, 2004
Sold by
Barnes Dorothy L
Bought by
Barnes Dorothy L and Barnes Gregg M
Purchase Details
Closed on
Mar 24, 2003
Sold by
Keller Kathleen Arnoldsen
Bought by
Barnes V Dorothy L
Home Financials for this Owner
Home Financials are based on the most recent Mortgage that was taken out on this home.
Original Mortgage
$129,600
Interest Rate
3.12%
Purchase Details
Closed on
Apr 25, 1994
Sold by
Keller Kathleen Arnoldsen
Bought by
Keller Kathleen Arnoldsen
Home Financials for this Owner
Home Financials are based on the most recent Mortgage that was taken out on this home.
Original Mortgage
$40,000
Interest Rate
7.79%
Create a Home Valuation Report for This Property
The Home Valuation Report is an in-depth analysis detailing your home's value as well as a comparison with similar homes in the area
Home Values in the Area
Average Home Value in this Area
Purchase History
| Date | Buyer | Sale Price | Title Company |
|---|---|---|---|
| Ramirez Maria Antonia Palo | -- | None Listed On Document | |
| Palomino Ramirez Maria A | -- | Accommodation | |
| Rodriguez Mayra | -- | Accommodation | |
| Palomino Ramirez Maria A | $68,183 | None Available | |
| Weiss Richard | -- | National Title Company | |
| Palomino Juan | $18,000 | National Title Company | |
| Weiss Richard | -- | National Title Company | |
| Rodriguez Mayra | $59,300 | National Title Company | |
| Gorman Jo A | $240,000 | None Available | |
| El Jawhari Dory | $252,000 | Southwest Title | |
| Gorman Jo A | $200,000 | Southwest Title | |
| Barnes Gregg M | -- | -- | |
| Barnes Dorothy L | -- | Lawyers Title Of Nevada | |
| Barnes V Dorothy L | $144,000 | Nevada Title Company | |
| Keller Kathleen Arnoldsen | -- | First American Title Company |
Source: Public Records
Mortgage History
| Date | Status | Borrower | Loan Amount |
|---|---|---|---|
| Previous Owner | El Jawhari Dory | $240,000 | |
| Previous Owner | Gorman Jo A | $160,000 | |
| Previous Owner | Barnes V Dorothy L | $129,600 | |
| Previous Owner | Keller Kathleen Arnoldsen | $40,000 | |
| Closed | Gorman Jo A | $40,000 |
Source: Public Records
Tax History Compared to Growth
Tax History
| Year | Tax Paid | Tax Assessment Tax Assessment Total Assessment is a certain percentage of the fair market value that is determined by local assessors to be the total taxable value of land and additions on the property. | Land | Improvement |
|---|---|---|---|---|
| 2025 | $961 | $53,139 | $31,500 | $21,639 |
| 2024 | $933 | $53,139 | $31,500 | $21,639 |
| 2023 | $933 | $48,230 | $28,700 | $19,530 |
| 2022 | $993 | $45,487 | $28,000 | $17,487 |
| 2021 | $920 | $41,094 | $24,850 | $16,244 |
| 2020 | $851 | $38,495 | $22,750 | $15,745 |
| 2019 | $798 | $36,765 | $20,650 | $16,115 |
| 2018 | $761 | $34,652 | $18,550 | $16,102 |
| 2017 | $977 | $33,311 | $16,450 | $16,861 |
| 2016 | $714 | $29,743 | $11,900 | $17,843 |
| 2015 | $711 | $27,558 | $9,450 | $18,108 |
| 2014 | $689 | $22,794 | $7,000 | $15,794 |
Source: Public Records
Map
Nearby Homes
- 2184 Sunnyslope Ave
- 5399 Surrey St
- 5473 Clydesdale St
- 1963 Rawhide St
- 5433 Latigo St
- 5375 Chestnut St
- 5551 Corral Cir
- 5473 S Eastern Ave
- 5514 Oxbow St
- 2033 Pommel Ave
- 5167 Martingale Ave
- 5143 Martingale Ave
- 5613 Chestnut St
- 2486 Leigh Ave
- 2174 E Russell Rd
- 2246 E Russell Rd
- 1673 Caliente Ct
- 1655 E Hacienda Ave
- 5086 Jeffreys St Unit 201
- 1688 Mapleton Ln
- 5394 Stirrup St
- 2124 Sunnyslope Ave
- 5401 Martingale Ct
- 5389 Martingale Ct
- 2144 Sunnyslope Ave
- 5380 Stirrup St
- 5401 Stirrup St
- 5413 Stirrup St
- 5377 Martingale Ct
- 5403 Martingale Ct
- 5389 Stirrup St
- 2164 Sunnyslope Ave
- 5425 Stirrup St
- 5366 Stirrup St
- 5377 Stirrup St
- 5365 Martingale Ct
- 2117 Sunnyslope Ave
- 2135 Sunnyslope Ave
- 5435 Stirrup St
- 5400 Surrey St