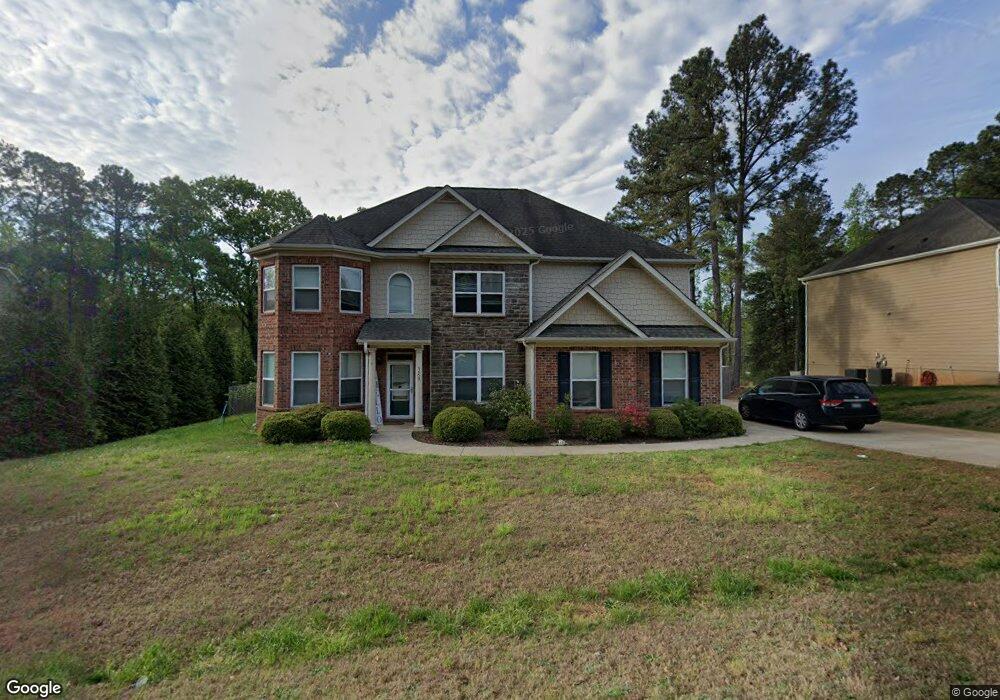
5409 Fantasy Moth Dr Garner, NC 27529
Estimated Value: $597,000 - $639,000
4
Beds
4
Baths
3,653
Sq Ft
$170/Sq Ft
Est. Value
About This Home
This home is located at 5409 Fantasy Moth Dr, Garner, NC 27529 and is currently estimated at $621,359, approximately $170 per square foot. 5409 Fantasy Moth Dr is a home located in Wake County with nearby schools including Aversboro Elementary, East Garner Middle School, and South Garner High.
Ownership History
Date
Name
Owned For
Owner Type
Purchase Details
Closed on
Dec 14, 2019
Sold by
White Guy E and White Shannon R
Bought by
Harris Jaryn
Current Estimated Value
Home Financials for this Owner
Home Financials are based on the most recent Mortgage that was taken out on this home.
Original Mortgage
$323,050
Outstanding Balance
$286,305
Interest Rate
3.87%
Mortgage Type
New Conventional
Estimated Equity
$335,054
Purchase Details
Closed on
Dec 16, 2013
Sold by
Peachtree Communities Llc
Bought by
White Guy E and White Shannon R
Home Financials for this Owner
Home Financials are based on the most recent Mortgage that was taken out on this home.
Original Mortgage
$108,650
Interest Rate
3.32%
Mortgage Type
Credit Line Revolving
Purchase Details
Closed on
Feb 4, 2013
Sold by
Winslow Property Development Co
Bought by
Peacthree Communities Llc
Create a Home Valuation Report for This Property
The Home Valuation Report is an in-depth analysis detailing your home's value as well as a comparison with similar homes in the area
Home Values in the Area
Average Home Value in this Area
Purchase History
| Date | Buyer | Sale Price | Title Company |
|---|---|---|---|
| Harris Jaryn | $360,000 | None Available | |
| White Guy E | $285,000 | None Available | |
| Peacthree Communities Llc | $115,500 | None Available |
Source: Public Records
Mortgage History
| Date | Status | Borrower | Loan Amount |
|---|---|---|---|
| Open | Harris Jaryn | $323,050 | |
| Previous Owner | White Guy E | $108,650 | |
| Previous Owner | White Guy E | $145,000 |
Source: Public Records
Tax History Compared to Growth
Tax History
| Year | Tax Paid | Tax Assessment Tax Assessment Total Assessment is a certain percentage of the fair market value that is determined by local assessors to be the total taxable value of land and additions on the property. | Land | Improvement |
|---|---|---|---|---|
| 2025 | $3,752 | $583,541 | $90,000 | $493,541 |
| 2024 | $3,644 | $583,541 | $90,000 | $493,541 |
| 2023 | $2,937 | $374,072 | $52,000 | $322,072 |
| 2022 | $2,722 | $374,072 | $52,000 | $322,072 |
| 2021 | $2,649 | $374,072 | $52,000 | $322,072 |
| 2020 | $2,605 | $374,072 | $52,000 | $322,072 |
| 2019 | $2,827 | $343,704 | $50,000 | $293,704 |
| 2018 | $2,599 | $343,704 | $50,000 | $293,704 |
| 2017 | $2,464 | $343,704 | $50,000 | $293,704 |
| 2016 | $2,414 | $343,704 | $50,000 | $293,704 |
| 2015 | -- | $342,858 | $54,000 | $288,858 |
| 2014 | -- | $54,000 | $54,000 | $0 |
Source: Public Records
Map
Nearby Homes
- 1208 Turner Farms Rd
- 5112 Solemn Grove Rd
- 1004 Cabin Hill Way
- 106 Village Ct
- 267 Dando St
- 5021 Glen Creek Trail
- 941 Grand Mesa Dr
- 937 Grand Mesa Dr
- 933 Grand Mesa Dr
- 929 Grand Mesa Dr
- 617 Red River Dr
- 925 Grand Mesa Dr
- 604 Red River Dr
- 921 Grand Mesa Dr
- 608 Red River Dr
- 625 Red River Dr
- 612 Red River Dr
- 917 Grand Mesa Dr
- 629 Red River Dr
- 616 Red River Dr
- 5409 Fantasy Moth Dr Unit 342
- 5405 Fantasy Moth Dr
- 5405 Fantasy Moth Dr Unit 343
- 5413 Fantasy Moth Dr
- 5413 Fantasy Moth Dr Unit 341
- 5401 Fantasy Moth Dr
- 5401 Fantasy Moth Dr Unit 344
- 5417 Fantasy Moth Dr Unit 340
- 5417 Fantasy Moth Dr
- 5432 Fantasy Moth Dr
- 5432 Fantasy Moth Dr Unit 353
- 5412 Fantasy Moth Dr
- 5412 Fantasy Moth Dr Unit 352
- 5321 Fantasy Moth Dr
- 5321 Fantasy Moth Dr Unit 345
- 5009 Maple Shady Ct Unit 351
- 5009 Maple Shady Ct
- 5421 Fantasy Moth Dr Unit 339
- 5421 Fantasy Moth Dr
- 5005 Maple Shady Ct