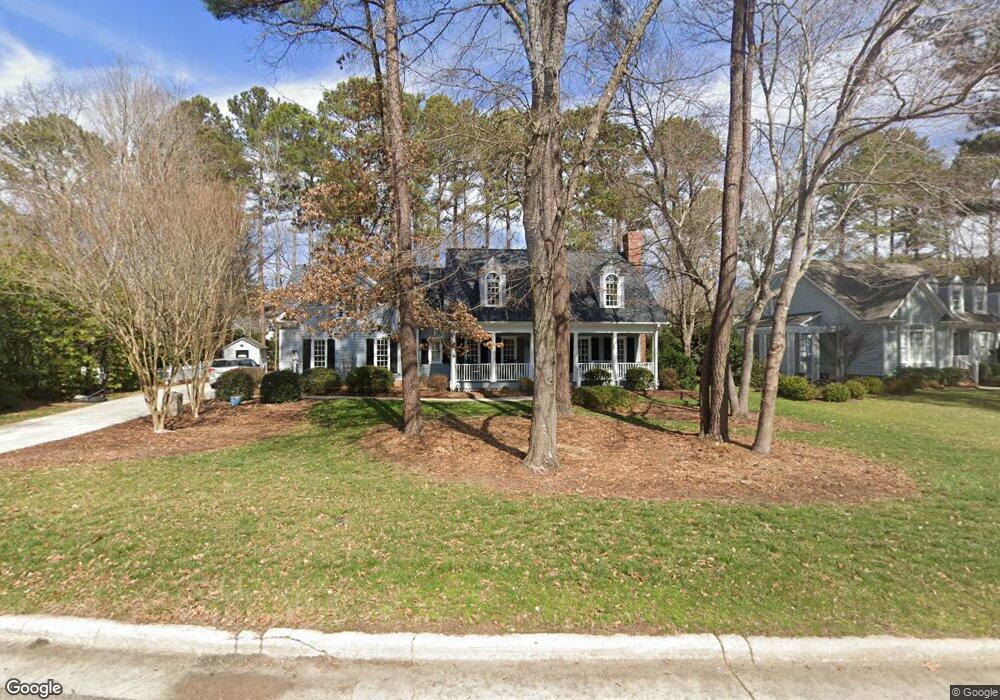
5409 Leopard's Bane Ct Holly Springs, NC 27540
Estimated Value: $666,000 - $719,000
4
Beds
3
Baths
2,636
Sq Ft
$262/Sq Ft
Est. Value
About This Home
This home is located at 5409 Leopard's Bane Ct, Holly Springs, NC 27540 and is currently estimated at $691,283, approximately $262 per square foot. 5409 Leopard's Bane Ct is a home located in Wake County with nearby schools including Middle Creek Elementary School, Holly Ridge Middle School, and Holly Springs High School.
Ownership History
Date
Name
Owned For
Owner Type
Purchase Details
Closed on
Mar 4, 2019
Sold by
Brest Regina E
Bought by
Tinsley John C and Tinsley Tracy L
Current Estimated Value
Home Financials for this Owner
Home Financials are based on the most recent Mortgage that was taken out on this home.
Original Mortgage
$382,500
Outstanding Balance
$336,283
Interest Rate
4.4%
Mortgage Type
New Conventional
Estimated Equity
$355,000
Purchase Details
Closed on
Feb 21, 2008
Sold by
Klugh Richard M and Klugh Mary C
Bought by
Brest Terence E and Brest Regina E
Home Financials for this Owner
Home Financials are based on the most recent Mortgage that was taken out on this home.
Original Mortgage
$246,000
Interest Rate
5.85%
Mortgage Type
Purchase Money Mortgage
Create a Home Valuation Report for This Property
The Home Valuation Report is an in-depth analysis detailing your home's value as well as a comparison with similar homes in the area
Home Values in the Area
Average Home Value in this Area
Purchase History
| Date | Buyer | Sale Price | Title Company |
|---|---|---|---|
| Tinsley John C | $425,000 | None Available | |
| Brest Terence E | $396,000 | None Available |
Source: Public Records
Mortgage History
| Date | Status | Borrower | Loan Amount |
|---|---|---|---|
| Open | Tinsley John C | $382,500 | |
| Previous Owner | Brest Terence E | $246,000 |
Source: Public Records
Tax History Compared to Growth
Tax History
| Year | Tax Paid | Tax Assessment Tax Assessment Total Assessment is a certain percentage of the fair market value that is determined by local assessors to be the total taxable value of land and additions on the property. | Land | Improvement |
|---|---|---|---|---|
| 2025 | $5,248 | $607,483 | $160,000 | $447,483 |
| 2024 | $5,226 | $607,483 | $160,000 | $447,483 |
| 2023 | $4,880 | $450,604 | $90,000 | $360,604 |
| 2022 | $4,711 | $450,604 | $90,000 | $360,604 |
| 2021 | $4,623 | $450,604 | $90,000 | $360,604 |
| 2020 | $4,623 | $450,604 | $90,000 | $360,604 |
| 2019 | $5,006 | $414,417 | $100,000 | $314,417 |
| 2018 | $0 | $414,417 | $100,000 | $314,417 |
| 2017 | $0 | $414,417 | $100,000 | $314,417 |
| 2016 | $4,301 | $414,417 | $100,000 | $314,417 |
| 2015 | $4,299 | $407,751 | $90,000 | $317,751 |
| 2014 | $4,151 | $407,751 | $90,000 | $317,751 |
Source: Public Records
Map
Nearby Homes
- 5317 Moonflower Ct
- 308 Wescott Ridge Dr
- 5420 Lake Edge Dr
- 101 Eden Glen Dr
- 108 Eden Glen Dr
- 212 Chieftain Dr
- 501 Wescott Ridge Dr
- 4225 Olive Hill Dr
- 4809 Greenpoint Ln
- 4900 Optimist Farm Rd
- 4830 Optimist Farm Rd
- 5309 Shoreline Ct
- 120 Breyla Way
- 129 Middlegreen Place
- 305 Savannah Ridge Rd
- 104 Amberglen Ln
- 436 Edgepine Dr
- 608 Skygrove Dr
- 215 Savannah Ridge Rd Unit 215
- 121 Amberglen Ln
- 5409 Leopards Bane Ct
- 5405 Leopards Bane Ct
- 248 Elmcrest Dr
- 252 Elmcrest Dr
- 256 Elmcrest Dr
- 5400 Leopards Bane Ct
- 5404 Leopards Bane Ct
- 240 Elmcrest Dr
- 5401 Leopards Bane Ct
- 260 Elmcrest Dr
- 5408 Leopards Bane Ct
- 237 Elmcrest Dr
- 241 Elmcrest Dr
- 264 Elmcrest Dr
- 236 Elmcrest Dr
- 5412 Leopards Bane Ct
- 245 Elmcrest Dr
- 5416 Leopards Bane Ct
- 5401 Bluebell Ct
- 4433 Lake Flower Dr