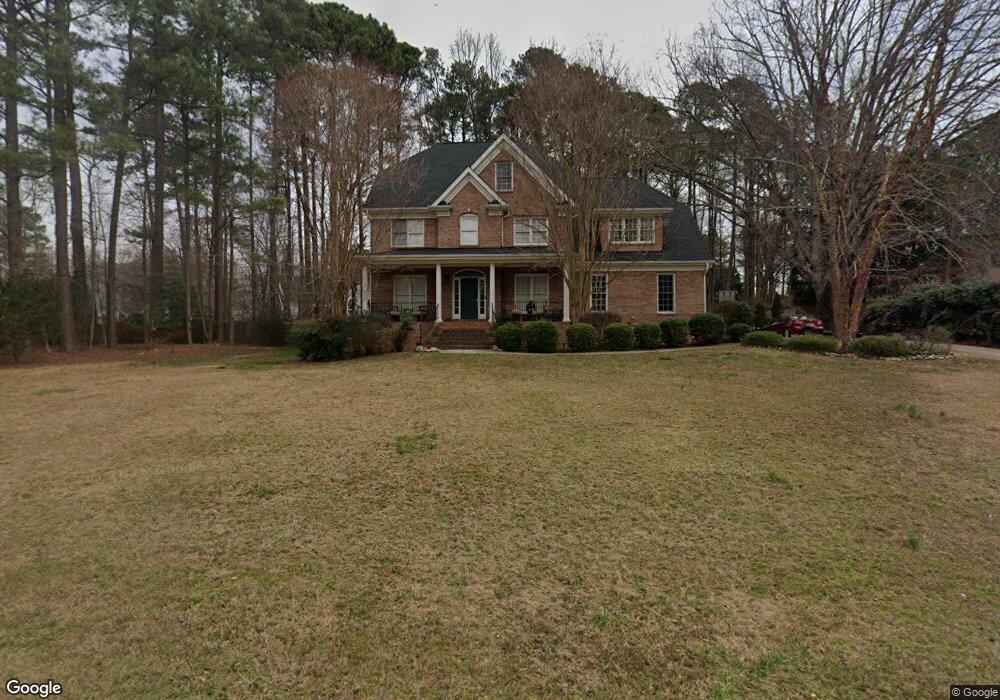
5409 Levering Mill Rd Apex, NC 27539
Middle Creek NeighborhoodEstimated Value: $760,021 - $891,000
3
Beds
3
Baths
3,162
Sq Ft
$261/Sq Ft
Est. Value
About This Home
This home is located at 5409 Levering Mill Rd, Apex, NC 27539 and is currently estimated at $826,755, approximately $261 per square foot. 5409 Levering Mill Rd is a home located in Wake County with nearby schools including Lufkin Road Middle School and Apex High School.
Ownership History
Date
Name
Owned For
Owner Type
Purchase Details
Closed on
Jul 8, 2015
Sold by
Anderson Jeffrey S and Anderson Dawnelle M
Bought by
Sands Randall G and Sands Henrietta M
Current Estimated Value
Home Financials for this Owner
Home Financials are based on the most recent Mortgage that was taken out on this home.
Original Mortgage
$333,000
Outstanding Balance
$257,456
Interest Rate
3.62%
Mortgage Type
Adjustable Rate Mortgage/ARM
Estimated Equity
$569,299
Purchase Details
Closed on
Aug 11, 2014
Sold by
Anderson Jeffrey
Bought by
Anderson Dawnelle
Purchase Details
Closed on
Jun 19, 2002
Sold by
Timberland Building Group Llc
Bought by
Anderson Jeffrey S and Anderson Dawnelle M
Home Financials for this Owner
Home Financials are based on the most recent Mortgage that was taken out on this home.
Original Mortgage
$275,600
Interest Rate
6.12%
Create a Home Valuation Report for This Property
The Home Valuation Report is an in-depth analysis detailing your home's value as well as a comparison with similar homes in the area
Home Values in the Area
Average Home Value in this Area
Purchase History
| Date | Buyer | Sale Price | Title Company |
|---|---|---|---|
| Sands Randall G | $422,000 | Attorney | |
| Anderson Dawnelle | -- | None Available | |
| Anderson Jeffrey S | $55,000 | -- |
Source: Public Records
Mortgage History
| Date | Status | Borrower | Loan Amount |
|---|---|---|---|
| Open | Sands Randall G | $333,000 | |
| Previous Owner | Anderson Jeffrey S | $275,600 |
Source: Public Records
Tax History
| Year | Tax Paid | Tax Assessment Tax Assessment Total Assessment is a certain percentage of the fair market value that is determined by local assessors to be the total taxable value of land and additions on the property. | Land | Improvement |
|---|---|---|---|---|
| 2025 | $4,647 | $723,491 | $195,000 | $528,491 |
| 2024 | $4,513 | $723,491 | $195,000 | $528,491 |
Source: Public Records
Map
Nearby Homes
- 2408 Merion Creek Dr
- 3332 Colby Chase Dr Unit Lot 3
- 3340 Colby Chase Dr Unit Lot 2
- 2353 Horton Park Dr
- 2349 Horton Park Dr
- 2345 Horton Park Dr
- 7828 Percussion Dr
- 2344 Horton Park Dr
- 2333 Horton Park Dr
- 2340 Horton Park Dr
- 2336 Horton Park Dr
- 2332 Horton Park Dr
- 2244 Warbler Dr
- 2256 Warbler Dr
- 2321 Horton Park Dr
- 2229 Redpoll Dr
- 2228 Warbler Dr
- 2222 Redpoll Dr
- 2225 Redpoll Dr
- 2283 Horton Park Dr
- 5405 Levering Mill Rd
- 5417 Levering Mill Rd
- 3109 Colby Chase Dr
- 3105 Colby Chase Dr
- 3117 Colby Chase Dr
- 5408 Levering Mill Rd
- 5404 Levering Mill Rd
- 3101 Colby Chase Dr
- 5421 Levering Mill Rd
- 5416 Levering Mill Rd
- 3205 Colby Chase Dr
- 3112 Colby Chase Dr
- 3108 Colby Chase Dr
- 5420 Levering Mill Rd
- 5412 Levering Mill Rd
- 3100 Colby Chase Dr
- 3209 Colby Chase Dr
- 3104 Colby Chase Dr
- 5313 Levering Mill Rd
- 8404 Smith Rd
Your Personal Tour Guide
Ask me questions while you tour the home.