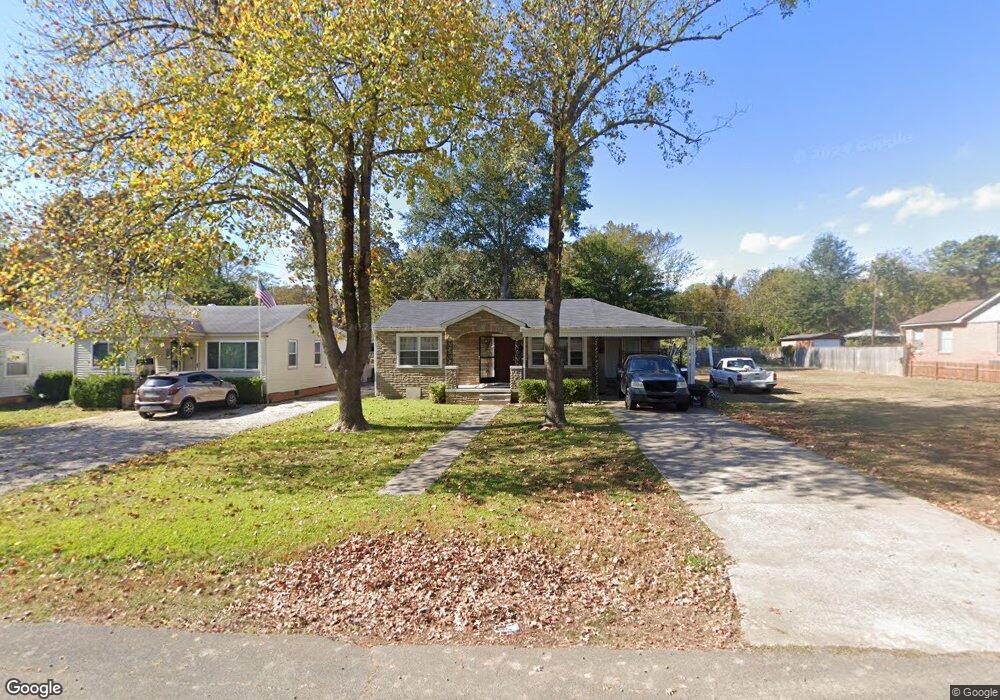
5409 Maple St North Little Rock, AR 72118
Amboy NeighborhoodEstimated Value: $147,000 - $162,008
3
Beds
2
Baths
1,864
Sq Ft
$82/Sq Ft
Est. Value
About This Home
This home is located at 5409 Maple St, North Little Rock, AR 72118 and is currently estimated at $152,752, approximately $81 per square foot. 5409 Maple St is a home located in Pulaski County with nearby schools including Indian Hills Elementary School, North Little Rock Middle School 6th Grade Campus, and North Little Rock High School.
Ownership History
Date
Name
Owned For
Owner Type
Purchase Details
Closed on
Nov 7, 2016
Sold by
Lopez Jorge A and Casagno Alma
Bought by
Casagnon Efren and Rivera Yolanda
Current Estimated Value
Purchase Details
Closed on
Aug 1, 2016
Sold by
U S Bank Trust Na
Bought by
Lopez Jorge A and Casagnon Efren
Purchase Details
Closed on
Mar 4, 2016
Sold by
Launius Jeremy and Case #60Cv-15-1679
Bought by
Us Bank Trust Na and Lsf9 Master Participation Trust
Purchase Details
Closed on
Aug 9, 2010
Sold by
Launius Jeremy and Moore Charles Edward
Bought by
Bac Home Loans Servicing Lp and Countrywide Home Loans Servicing Lp
Purchase Details
Closed on
Jan 8, 2008
Sold by
Jordan Vera L
Bought by
Launius Jeremy and Moore Charles Edward
Home Financials for this Owner
Home Financials are based on the most recent Mortgage that was taken out on this home.
Original Mortgage
$75,949
Interest Rate
6.07%
Mortgage Type
FHA
Purchase Details
Closed on
Sep 22, 2005
Sold by
Jordan Vera L
Bought by
Wilson Dutchie
Create a Home Valuation Report for This Property
The Home Valuation Report is an in-depth analysis detailing your home's value as well as a comparison with similar homes in the area
Home Values in the Area
Average Home Value in this Area
Purchase History
| Date | Buyer | Sale Price | Title Company |
|---|---|---|---|
| Casagnon Efren | -- | Attorney | |
| Lopez Jorge A | $30,000 | Realty Title | |
| Us Bank Trust Na | $91,709 | Attorney | |
| Bac Home Loans Servicing Lp | $81,690 | None Available | |
| Launius Jeremy | -- | American Abstract & Title Co | |
| Launius Jeremy | $77,000 | American Abstract & Title Co | |
| Wilson Dutchie | -- | -- |
Source: Public Records
Mortgage History
| Date | Status | Borrower | Loan Amount |
|---|---|---|---|
| Previous Owner | Launius Jeremy | $75,949 |
Source: Public Records
Tax History Compared to Growth
Tax History
| Year | Tax Paid | Tax Assessment Tax Assessment Total Assessment is a certain percentage of the fair market value that is determined by local assessors to be the total taxable value of land and additions on the property. | Land | Improvement |
|---|---|---|---|---|
| 2025 | $1,707 | $26,905 | $2,000 | $24,905 |
| 2024 | $1,344 | $26,905 | $2,000 | $24,905 |
| 2023 | $1,344 | $23,155 | $2,000 | $21,155 |
| 2022 | $1,232 | $23,155 | $2,000 | $21,155 |
| 2021 | $1,120 | $16,760 | $3,100 | $13,660 |
| 2020 | $1,120 | $16,760 | $3,100 | $13,660 |
| 2019 | $1,120 | $16,760 | $3,100 | $13,660 |
| 2018 | $1,120 | $16,760 | $3,100 | $13,660 |
| 2017 | $1,120 | $16,760 | $3,100 | $13,660 |
| 2016 | $1,125 | $16,840 | $3,000 | $13,840 |
| 2015 | $1,125 | $16,840 | $3,000 | $13,840 |
| 2014 | $1,125 | $16,840 | $3,000 | $13,840 |
Source: Public Records
Map
Nearby Homes
- 5424 Maple St
- 407 W 51st St
- 308 W 50th St
- 4920 Willow St
- 5315 Chandler St
- 5732 Camp Robinson Rd
- 4800 Camp Robinson
- 601 W 50th St
- 34 Jaynelle Place
- 0 W Hill Ct
- 5321 Marion St
- 901 W 58th St
- 321 W 47th St
- 4707 Ridge Rd
- 60 Oakview Dr
- 909 W 50th St
- 4709 N Cypress St
- 5630 Foxboro Dr
- 9 Blackstone Cir
- 801 Green Hills Dr