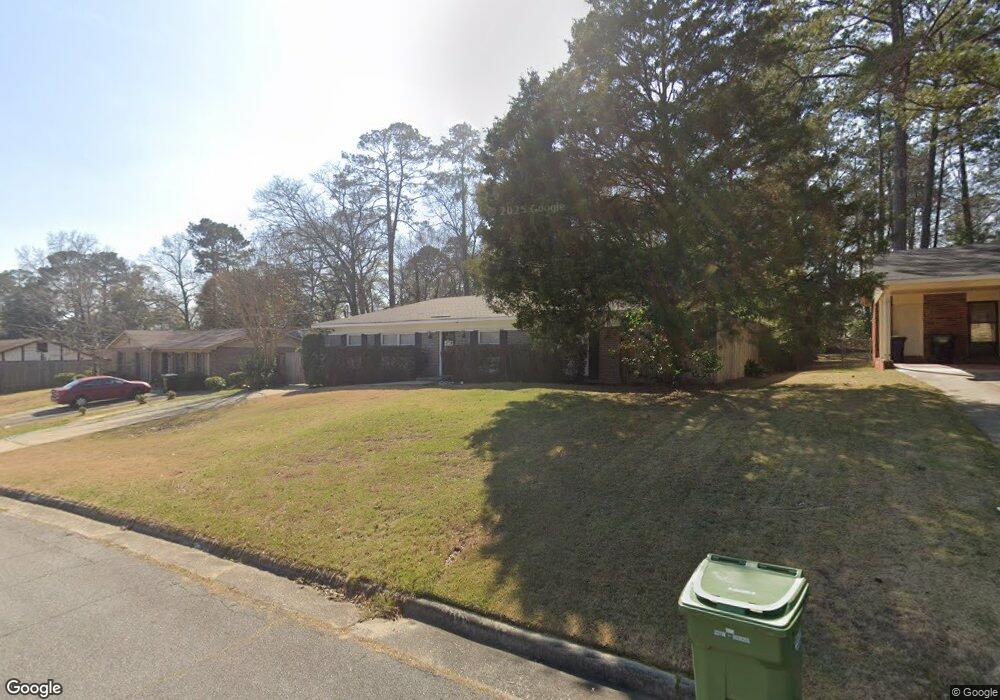
5409 Rockhurst Dr Columbus, GA 31907
Midland NeighborhoodEstimated Value: $180,000 - $216,795
3
Beds
3
Baths
1,485
Sq Ft
$133/Sq Ft
Est. Value
About This Home
This home is located at 5409 Rockhurst Dr, Columbus, GA 31907 and is currently estimated at $198,199, approximately $133 per square foot. 5409 Rockhurst Dr is a home located in Muscogee County with nearby schools including Waddell Elementary School, Midland Middle School, and Hardaway High School.
Ownership History
Date
Name
Owned For
Owner Type
Purchase Details
Closed on
Sep 29, 2016
Sold by
Hud & Housing Of Urban Dev
Bought by
Bailey Jayson
Current Estimated Value
Home Financials for this Owner
Home Financials are based on the most recent Mortgage that was taken out on this home.
Original Mortgage
$83,460
Outstanding Balance
$66,459
Interest Rate
3.25%
Mortgage Type
FHA
Estimated Equity
$131,740
Purchase Details
Closed on
Feb 2, 2016
Sold by
Anderson Mindi M
Bought by
Wells Fargo Bank
Purchase Details
Closed on
Jul 19, 2013
Sold by
Old Boyz Investments Llc
Bought by
Anderson Mindi M
Home Financials for this Owner
Home Financials are based on the most recent Mortgage that was taken out on this home.
Original Mortgage
$118,808
Interest Rate
3.75%
Mortgage Type
FHA
Purchase Details
Closed on
Jun 5, 2012
Sold by
Thacker Joki
Bought by
Old Boys Investments Llc
Create a Home Valuation Report for This Property
The Home Valuation Report is an in-depth analysis detailing your home's value as well as a comparison with similar homes in the area
Home Values in the Area
Average Home Value in this Area
Purchase History
| Date | Buyer | Sale Price | Title Company |
|---|---|---|---|
| Bailey Jayson | $85,000 | -- | |
| Wells Fargo Bank | $88,550 | -- | |
| Sec Of Housing & Urban | -- | -- | |
| Anderson Mindi M | $121,000 | -- | |
| Old Boys Investments Llc | $52,001 | -- |
Source: Public Records
Mortgage History
| Date | Status | Borrower | Loan Amount |
|---|---|---|---|
| Open | Bailey Jayson | $83,460 | |
| Previous Owner | Anderson Mindi M | $118,808 |
Source: Public Records
Tax History Compared to Growth
Tax History
| Year | Tax Paid | Tax Assessment Tax Assessment Total Assessment is a certain percentage of the fair market value that is determined by local assessors to be the total taxable value of land and additions on the property. | Land | Improvement |
|---|---|---|---|---|
| 2025 | $1,091 | $55,240 | $10,780 | $44,460 |
| 2024 | $1,090 | $55,240 | $10,780 | $44,460 |
| 2023 | $403 | $55,240 | $10,780 | $44,460 |
| 2022 | $1,137 | $44,796 | $10,780 | $34,016 |
| 2021 | $1,130 | $41,060 | $10,780 | $30,280 |
| 2020 | $1,130 | $41,060 | $10,780 | $30,280 |
| 2019 | $1,136 | $41,060 | $10,780 | $30,280 |
| 2018 | $1,136 | $41,060 | $10,780 | $30,280 |
| 2017 | $1,397 | $34,000 | $7,800 | $26,200 |
| 2016 | $1,997 | $48,400 | $5,981 | $42,419 |
| 2015 | $1,451 | $48,400 | $5,981 | $42,419 |
| 2014 | $1,454 | $48,400 | $5,981 | $42,419 |
| 2013 | -- | $43,820 | $5,981 | $37,839 |
Source: Public Records
Map
Nearby Homes
- 5434 Rockhurst Dr
- 6236 Olde Towne Dr
- 6215 Parker Dr
- 5640 Lakeshore Rd
- 5717 Flat Rock Rd
- 5804 Dearborn Ave
- 7101 Cross Tie Dr
- 4931 Woodruff Farm Rd
- 5966 Fornof Rd
- 6321 Milgen Rd Unit 3
- 4700 Bondale Dr
- 5408 Old Dominion Rd
- 5422 Colony Dr
- 6222 Goodwin Dr
- 5324 Colony Dr
- 6251 Rockefeller Dr
- 7170 Beaver Run Rd
- 6454 Patriot Dr
- 6 Jamestown Ct
- 6437 Woodbriar Ln
- 5401 Rockhurst Dr
- 5415 Rockhurst Dr
- 5375 Rockhurst Dr
- 5410 Rockhurst Dr
- 5416 Rockhurst Dr
- 6401 Garnet Dr
- 5427 Rockhurst Dr
- 5369 Rockhurst Dr
- 5422 Rockhurst Dr
- 4 Parker Ct
- 6411 Garnet Dr
- 5428 Rockhurst Dr
- 6400 Garnet Dr
- 3 Parker Ct
- 5363 Rockhurst Dr
- 5433 Rockhurst Dr
- 4 Ellsworth Ct
- 5 Ellsworth Ct
- 5 Parker Ct
- 6417 Garnet Dr