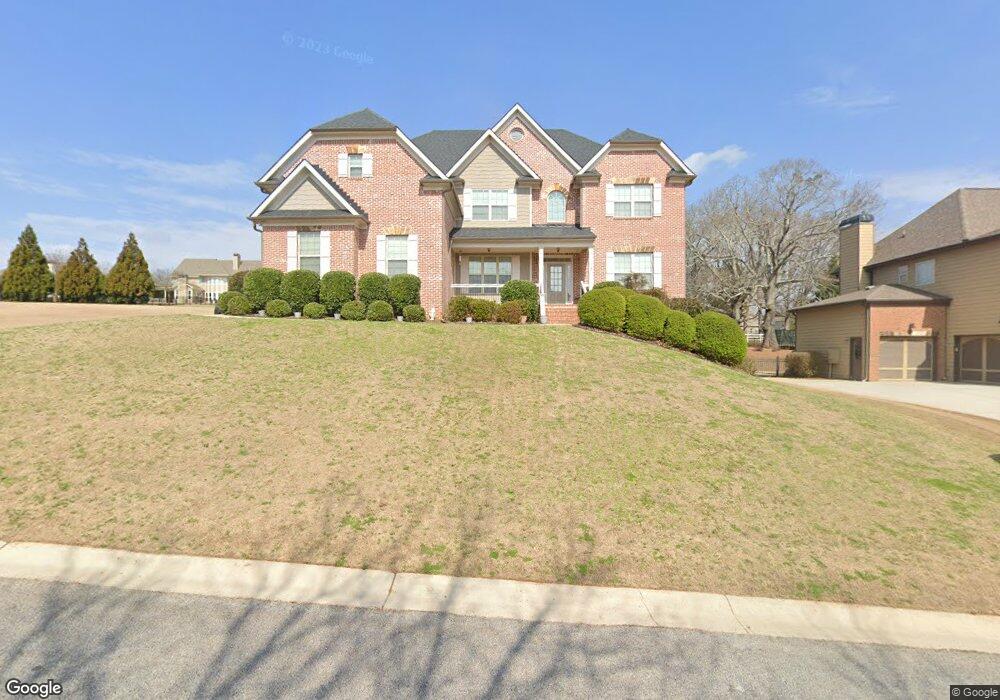
541 Delaperriere Loop Jefferson, GA 30549
Estimated Value: $728,000 - $854,000
Studio
4
Baths
4,547
Sq Ft
$173/Sq Ft
Est. Value
About This Home
This home is located at 541 Delaperriere Loop, Jefferson, GA 30549 and is currently estimated at $784,857, approximately $172 per square foot. 541 Delaperriere Loop is a home located in Jackson County with nearby schools including Gum Springs Elementary School, West Jackson Middle School, and Jackson County High School.
Ownership History
Date
Name
Owned For
Owner Type
Purchase Details
Closed on
Dec 15, 2009
Sold by
The Private Bank
Bought by
Carlson Richard D
Current Estimated Value
Home Financials for this Owner
Home Financials are based on the most recent Mortgage that was taken out on this home.
Original Mortgage
$286,100
Outstanding Balance
$183,560
Interest Rate
4.82%
Mortgage Type
New Conventional
Estimated Equity
$601,297
Purchase Details
Closed on
Oct 7, 2008
Sold by
Not Provided
Bought by
Carlson Richard D
Purchase Details
Closed on
Oct 13, 2005
Sold by
Lpi Builders Grp Llc
Bought by
Wd Thomas Homes Inc
Purchase Details
Closed on
Sep 27, 2005
Sold by
Lpi Builders Group Llc
Bought by
W D Thomas Homes Inc
Purchase Details
Closed on
Jul 22, 2005
Sold by
Braselton Land
Bought by
Lpi Builders Grp Llc
Purchase Details
Closed on
May 31, 2005
Sold by
Bluegreen Communities Of G
Bought by
Braselton Land
Create a Home Valuation Report for This Property
The Home Valuation Report is an in-depth analysis detailing your home's value as well as a comparison with similar homes in the area
Home Values in the Area
Average Home Value in this Area
Purchase History
| Date | Buyer | Sale Price | Title Company |
|---|---|---|---|
| Carlson Richard D | $312,000 | -- | |
| Carlson Richard D | $251,024 | -- | |
| Wd Thomas Homes Inc | $380,000 | -- | |
| W D Thomas Homes Inc | $76,000 | -- | |
| Lpi Builders Grp Llc | $3,407,950 | -- | |
| Braselton Land | $3,702,250 | -- |
Source: Public Records
Mortgage History
| Date | Status | Borrower | Loan Amount |
|---|---|---|---|
| Open | Carlson Richard D | $286,100 |
Source: Public Records
Tax History
| Year | Tax Paid | Tax Assessment Tax Assessment Total Assessment is a certain percentage of the fair market value that is determined by local assessors to be the total taxable value of land and additions on the property. | Land | Improvement |
|---|---|---|---|---|
| 2025 | $8,698 | $342,000 | $58,000 | $284,000 |
| 2024 | $8,698 | $320,000 | $36,000 | $284,000 |
| 2023 | $8,246 | $289,080 | $36,000 | $253,080 |
| 2022 | $6,828 | $236,640 | $32,400 | $204,240 |
| 2021 | $6,687 | $230,240 | $26,000 | $204,240 |
| 2020 | $6,053 | $190,760 | $26,000 | $164,760 |
| 2019 | $6,144 | $190,760 | $26,000 | $164,760 |
| 2018 | $5,962 | $182,920 | $26,000 | $156,920 |
| 2017 | $5,695 | $171,540 | $26,000 | $145,540 |
| 2016 | $5,726 | $171,540 | $26,000 | $145,540 |
| 2015 | $5,051 | $151,540 | $6,000 | $145,540 |
| 2014 | $4,604 | $137,888 | $6,000 | $131,888 |
| 2013 | -- | $137,888 | $6,000 | $131,888 |
Source: Public Records
Map
Nearby Homes
- 463 Delaperriere Loop
- 776 High Falls Ct
- 4057 Links Blvd
- 4040 Links Blvd
- 4034 Links Blvd
- 742 Brassie Falls Ln
- 4820 Anvil Ct
- 4022 Links Blvd
- 4016 Links Blvd
- 4806 Anvil Ct
- 824 Low Falls Ct
- 4611 Blacksmith Ln
- 799 Traditions Way
- 1049 Amber Waves Ave
- 905 Old Forge Ln
- 2253 Cotton Gin Row
- 971 Traditions Way
- 943 Liberty Bell Run
- 423 Delaperriere Loop
- 533 Delaperriere Loop
- 533 Delaperriere Loop Unit D37
- 415 Delaperriere Loop
- 418 Delaperriere Loop
- 427 Delaperriere Loop
- 422 Delaperriere Loop
- D-46 Delaperrier Loop
- D-44 Delaperrier Loop
- D-57 Delaperriere Loop
- D 57 Delaperriere Loop
- 414 Delaperriere Loop
- 525 Delaperriere Loop Unit 38
- 525 Delaperriere Loop
- 565 Colonial Ct
- 447 Delaperriere Loop
- 447 Delaperriere Loop Unit D51
- 526 Delaperriere Loop
- 410 Delaperriere Loop
- 410 Delaperriere Loop Unit 3
Your Personal Tour Guide
Ask me questions while you tour the home.