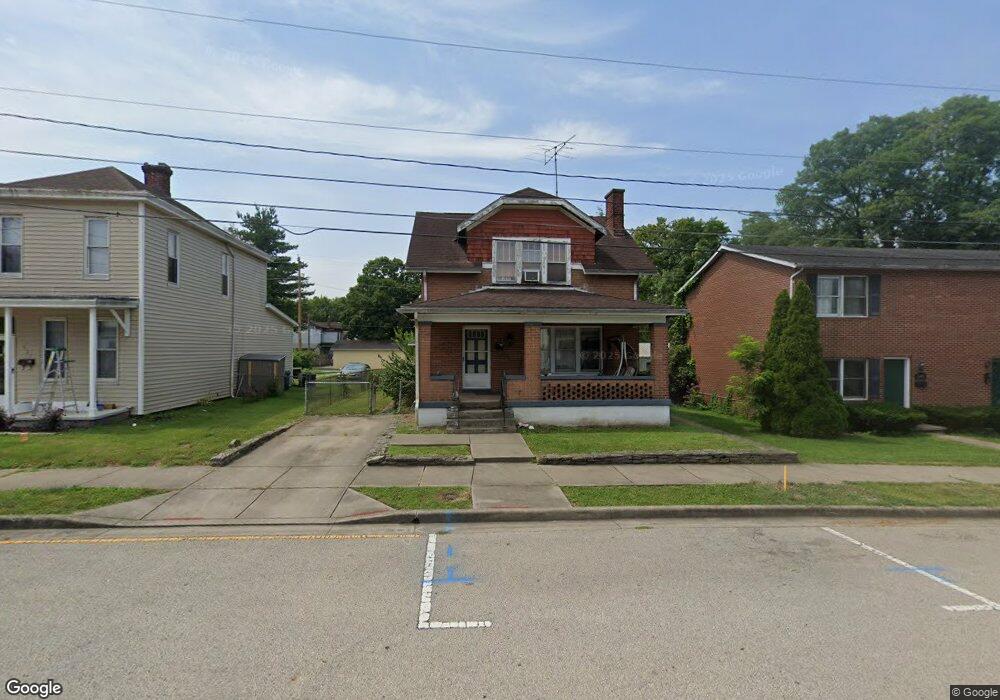
541 Front St Lawrenceburg, IN 47025
Estimated Value: $153,000 - $212,182
3
Beds
2
Baths
1,248
Sq Ft
$147/Sq Ft
Est. Value
About This Home
This home is located at 541 Front St, Lawrenceburg, IN 47025 and is currently estimated at $183,546, approximately $147 per square foot. 541 Front St is a home located in Dearborn County with nearby schools including Lawrenceburg Primary School, Central Elementary School, and Greendale Middle School.
Ownership History
Date
Name
Owned For
Owner Type
Purchase Details
Closed on
Dec 6, 2016
Sold by
Denison Danny W and Denison Judith E
Bought by
Stiles Scott Charles
Current Estimated Value
Home Financials for this Owner
Home Financials are based on the most recent Mortgage that was taken out on this home.
Original Mortgage
$88,369
Outstanding Balance
$70,755
Interest Rate
3.25%
Mortgage Type
FHA
Estimated Equity
$112,791
Purchase Details
Closed on
Jan 30, 2006
Sold by
Lusby David
Bought by
Denison Danny W and Denison Judith E
Create a Home Valuation Report for This Property
The Home Valuation Report is an in-depth analysis detailing your home's value as well as a comparison with similar homes in the area
Home Values in the Area
Average Home Value in this Area
Purchase History
| Date | Buyer | Sale Price | Title Company |
|---|---|---|---|
| Stiles Scott Charles | -- | None Available | |
| Denison Danny W | $80,751 | -- |
Source: Public Records
Mortgage History
| Date | Status | Borrower | Loan Amount |
|---|---|---|---|
| Open | Stiles Scott Charles | $88,369 |
Source: Public Records
Tax History Compared to Growth
Tax History
| Year | Tax Paid | Tax Assessment Tax Assessment Total Assessment is a certain percentage of the fair market value that is determined by local assessors to be the total taxable value of land and additions on the property. | Land | Improvement |
|---|---|---|---|---|
| 2024 | $1,230 | $123,000 | $17,100 | $105,900 |
| 2023 | $1,083 | $108,300 | $17,100 | $91,200 |
| 2022 | $1,104 | $110,400 | $17,100 | $93,300 |
| 2021 | $1,069 | $106,900 | $17,100 | $89,800 |
| 2020 | $1,051 | $106,900 | $17,100 | $89,800 |
| 2019 | $789 | $98,800 | $17,100 | $81,700 |
| 2018 | $798 | $98,800 | $17,100 | $81,700 |
| 2017 | $772 | $97,700 | $17,100 | $80,600 |
| 2016 | $845 | $97,700 | $17,100 | $80,600 |
| 2014 | $1,904 | $95,200 | $17,100 | $78,100 |
| 2013 | $1,904 | $93,000 | $17,100 | $75,900 |
Source: Public Records
Map
Nearby Homes