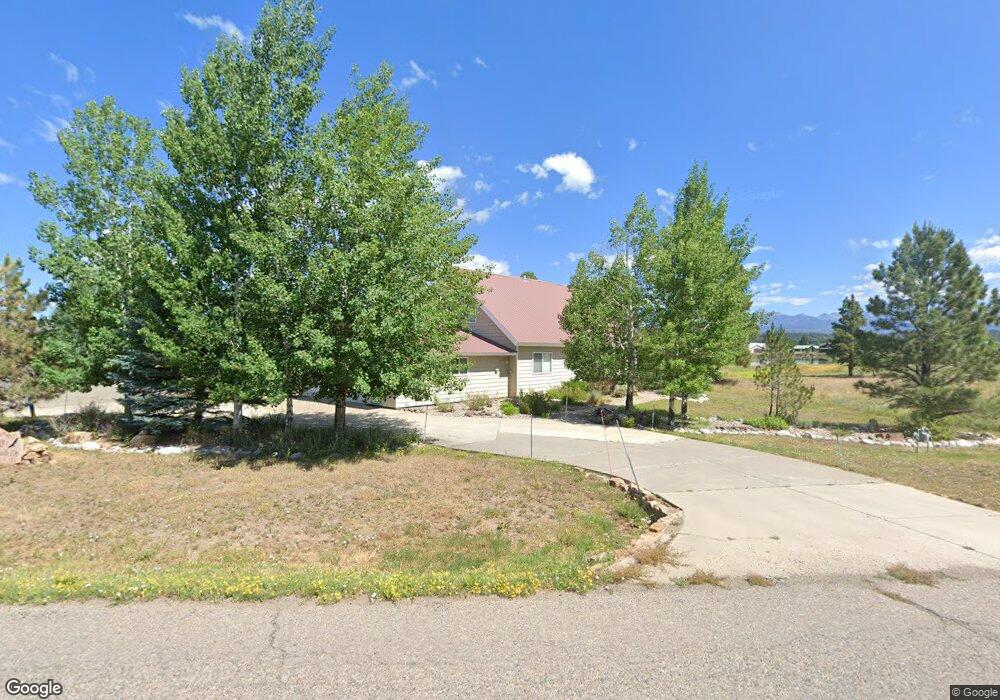
541 Lakeside Dr Pagosa Springs, CO 81147
Estimated Value: $530,181 - $611,000
3
Beds
3
Baths
1,680
Sq Ft
$345/Sq Ft
Est. Value
About This Home
This home is located at 541 Lakeside Dr, Pagosa Springs, CO 81147 and is currently estimated at $580,295, approximately $345 per square foot. 541 Lakeside Dr is a home located in Archuleta County with nearby schools including Pagosa Springs Elementary School, Pagosa Springs Middle School, and Pagosa Springs High School.
Ownership History
Date
Name
Owned For
Owner Type
Purchase Details
Closed on
Oct 22, 2008
Sold by
Veik Linda and Veik Larry J
Bought by
Winchell Adrian H and Olcsvary Kelly R
Current Estimated Value
Purchase Details
Closed on
Mar 1, 2007
Sold by
Veik Linda
Bought by
Vinda Linda and Vinda Larry J
Purchase Details
Closed on
Apr 18, 2006
Sold by
Veik Linda Leslie and Hartman Jean M
Bought by
Viek Linda
Purchase Details
Closed on
May 29, 1998
Sold by
Peper Douglas C and Peper Bunny
Bought by
Veik Linda Leslie and Hartman Jean M
Purchase Details
Closed on
Apr 18, 1996
Sold by
Thompson Wayne C and Thompson Peggy Jane
Bought by
Peper Douglas C and Peper Bunny
Purchase Details
Closed on
May 17, 1993
Sold by
Houle Glenn J and Houle Mary A
Bought by
Thompson Wayne C and Thompson Peggy Jane
Purchase Details
Closed on
Feb 14, 1992
Sold by
Fpi
Bought by
Clt
Purchase Details
Closed on
Dec 30, 1991
Sold by
Fpi
Bought by
Houle Glenn and Houle Mary
Create a Home Valuation Report for This Property
The Home Valuation Report is an in-depth analysis detailing your home's value as well as a comparison with similar homes in the area
Home Values in the Area
Average Home Value in this Area
Purchase History
| Date | Buyer | Sale Price | Title Company |
|---|---|---|---|
| Winchell Adrian H | $269,000 | None Available | |
| Vinda Linda | -- | None Available | |
| Viek Linda | -- | None Available | |
| Veik Linda Leslie | $180,000 | -- | |
| Peper Douglas C | $17,500 | -- | |
| Thompson Wayne C | $20,000 | -- | |
| Clt | -- | -- | |
| Houle Glenn | $12,500 | -- |
Source: Public Records
Tax History Compared to Growth
Tax History
| Year | Tax Paid | Tax Assessment Tax Assessment Total Assessment is a certain percentage of the fair market value that is determined by local assessors to be the total taxable value of land and additions on the property. | Land | Improvement |
|---|---|---|---|---|
| 2024 | $2,023 | $33,390 | $4,030 | $29,360 |
| 2023 | $2,023 | $33,390 | $4,030 | $29,360 |
| 2022 | $1,364 | $20,980 | $1,740 | $19,240 |
| 2021 | $1,479 | $21,580 | $1,790 | $19,790 |
| 2020 | $1,520 | $21,840 | $2,140 | $19,700 |
| 2019 | $1,500 | $21,840 | $2,140 | $19,700 |
| 2018 | $1,240 | $16,450 | $1,440 | $15,010 |
| 2017 | $1,088 | $16,450 | $1,440 | $15,010 |
| 2016 | $899 | $13,420 | $1,710 | $11,710 |
| 2015 | -- | $13,420 | $1,710 | $11,710 |
| 2014 | -- | $12,960 | $2,210 | $10,750 |
Source: Public Records
Map
Nearby Homes
- 1259 Lakeside Dr
- 425 and X Lakeside Dr
- 631 Lakeside Dr
- 578 Lakeside Dr Unit B8
- 120 Glen Eaton Dr
- 438 Lakewood St
- 171 Glen Eaton Dr
- 377 Lakewood St
- 31 Capstone Cir
- 646 N Pagosa Blvd
- 274 Lakeside Dr
- 26 Steamboat Dr
- 279 Woodsman Dr
- 66 Antelope Ave
- 69 Northshore Cir
- 97 Sandlewood Dr
- X N Pagosa Blvd
- 219 Lakeside Dr
- 63 Redwood Dr
- 2019 Vista Blvd
- 194 Teal Cir
- 0 Tall Pine Place
- 0 Tall Pine Place Unit 758250
- 0 Tall Pine Place Unit 739182
- 0 Tall Pine Place Unit 616048
- 0 Tall Pine Place Unit 675544
- 0 Tall Pine Place Unit 705055
- 0 Tall Pine Place Unit 722898
- 0 Tall Pine Place Unit 732790
- 0 Tall Pine Place Unit 691960
- 0 Tall Pine Place Unit 613689
- 0 Tall Pine Place Unit 635387
- 0 Tall Pine Place Unit 651612
- 0 Tall Pine Place Unit 654655
- 0 Tall Pine Place Unit 654715
- 0 Tall Pine Place Unit 654990
- 0 Tall Pine Place Unit 675511
- 0 Tall Pine Place Unit 679584
- 0 Tall Pine Place Unit 686723
- 159 Teal Cir