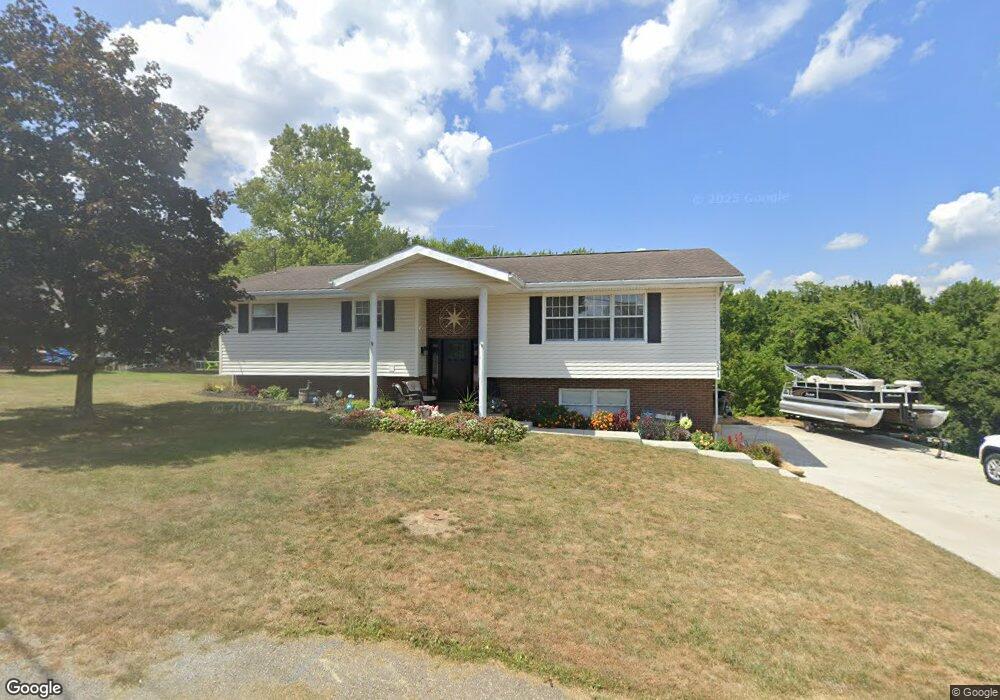
541 Longvue Dr Steubenville, OH 43953
Estimated Value: $247,718 - $281,000
3
Beds
2
Baths
2,604
Sq Ft
$101/Sq Ft
Est. Value
About This Home
This home is located at 541 Longvue Dr, Steubenville, OH 43953 and is currently estimated at $263,430, approximately $101 per square foot. 541 Longvue Dr is a home located in Jefferson County with nearby schools including Cross Creek Elementary School, Indian Creek Middle School, and Indian Creek High School.
Ownership History
Date
Name
Owned For
Owner Type
Purchase Details
Closed on
Mar 15, 2021
Sold by
Smarrella Matthew A
Bought by
Smarrella Matthew A and Smarrella Kalie
Current Estimated Value
Home Financials for this Owner
Home Financials are based on the most recent Mortgage that was taken out on this home.
Original Mortgage
$164,000
Outstanding Balance
$147,014
Interest Rate
2.7%
Mortgage Type
New Conventional
Estimated Equity
$116,416
Purchase Details
Closed on
Mar 14, 2018
Sold by
Smarrella Jenna D
Bought by
Smarrella Matthew A
Purchase Details
Closed on
May 10, 2011
Sold by
Petrosky Karen S
Bought by
Smarrella Matthew A and Smarrella Jenna D
Home Financials for this Owner
Home Financials are based on the most recent Mortgage that was taken out on this home.
Original Mortgage
$155,989
Interest Rate
4.87%
Mortgage Type
FHA
Create a Home Valuation Report for This Property
The Home Valuation Report is an in-depth analysis detailing your home's value as well as a comparison with similar homes in the area
Home Values in the Area
Average Home Value in this Area
Purchase History
| Date | Buyer | Sale Price | Title Company |
|---|---|---|---|
| Smarrella Matthew A | -- | None Available | |
| Smarrella Matthew A | -- | None Listed On Document | |
| Smarrella Matthew A | -- | None Available | |
| Smarrella Matthew A | -- | -- |
Source: Public Records
Mortgage History
| Date | Status | Borrower | Loan Amount |
|---|---|---|---|
| Open | Smarrella Matthew A | $164,000 | |
| Closed | Smarrella Matthew A | $164,000 | |
| Previous Owner | Smarrella Matthew A | $155,989 |
Source: Public Records
Tax History Compared to Growth
Tax History
| Year | Tax Paid | Tax Assessment Tax Assessment Total Assessment is a certain percentage of the fair market value that is determined by local assessors to be the total taxable value of land and additions on the property. | Land | Improvement |
|---|---|---|---|---|
| 2024 | $2,420 | $56,655 | $10,056 | $46,599 |
| 2023 | $2,420 | $46,736 | $8,236 | $38,500 |
| 2022 | $2,132 | $46,736 | $8,236 | $38,500 |
| 2021 | $2,132 | $46,736 | $8,236 | $38,500 |
| 2020 | $2,002 | $42,424 | $7,830 | $34,594 |
| 2019 | $2,005 | $0 | $0 | $0 |
| 2018 | $1,998 | $0 | $0 | $0 |
| 2017 | $2,296 | $0 | $0 | $0 |
| 2016 | $2,354 | $0 | $0 | $0 |
| 2015 | $2,137 | $0 | $0 | $0 |
| 2014 | $1,961 | $0 | $0 | $0 |
| 2012 | $950 | $50,610 | $7,945 | $42,665 |
Source: Public Records
Map
Nearby Homes
- 450 Two Ridge Rd
- 300 Harmony Dr
- 116 Brentwood Blvd
- 129 Reichart Ave
- 440 Woodvue Ln
- 0 Linmar Ave
- 0 Linmar Ave Unit 5151191
- 87 S Byron Dr
- 0 Kragel Rd
- 704 Douglas Ave
- 806 Bantam Ridge Rd
- 186 Bennett Blvd
- 714 Douglas Ave
- 204 Reichart Ave Unit 4
- 204 Reichart Ave Unit 3
- 204 Reichart Ave Unit 1
- 204 Reichart Ave Unit 2
- 204 Reichart Ave Unit 5
- 572 County Road 22a
- 183 Meadow Rd
- 521 Longvue Dr
- 557 Longvue Dr
- 532 Longvue Dr
- 505 Longvue Dr
- 579 Longvue Dr
- 568 Longvue Dr
- 46 Meadow Ln
- 506 Longvue Dr
- 485 Longvue Dr
- 599 Longvue Dr
- 488 Longvue Dr
- 461 Longvue Dr
- 515 Morningside Dr
- 617 Longvue Dr
- 63 Meadow Ln
- 470 Longvue Dr
- 614 Longvue Dr
- 454 Longvue Dr
- 601 Morningside Dr
- 483 Morningside Dr