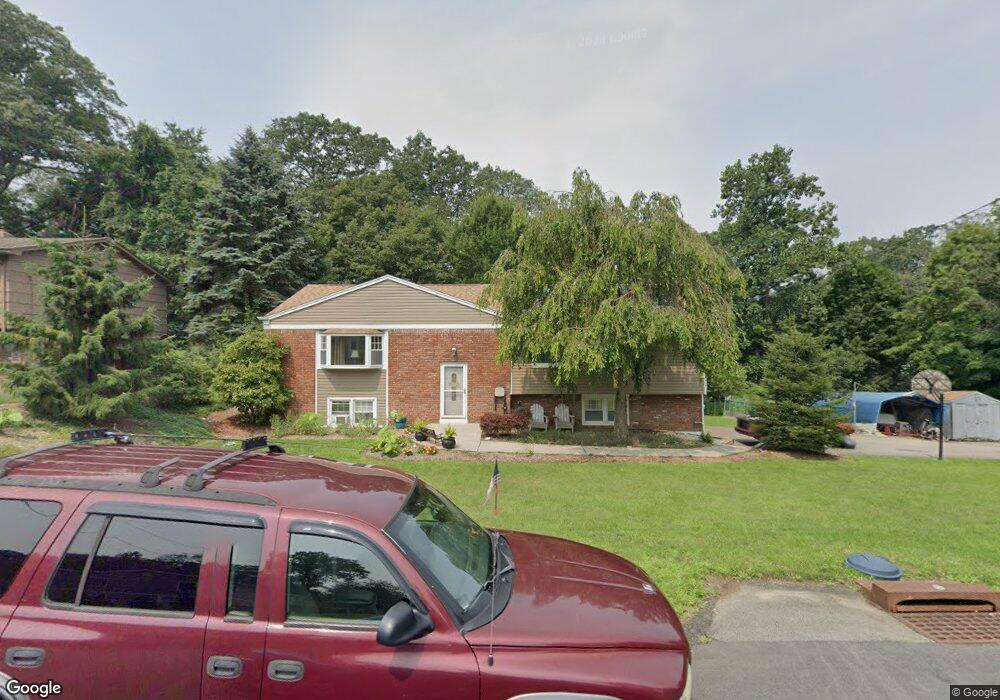
541 Mansel Dr Landing, NJ 07850
Estimated Value: $561,000 - $635,000
--
Bed
--
Bath
2,352
Sq Ft
$256/Sq Ft
Est. Value
About This Home
This home is located at 541 Mansel Dr, Landing, NJ 07850 and is currently estimated at $601,078, approximately $255 per square foot. 541 Mansel Dr is a home located in Morris County with nearby schools including Edith M. Decker Elementary School, Mt. Arlington Public School, and Elite Prepartory Academy.
Ownership History
Date
Name
Owned For
Owner Type
Purchase Details
Closed on
Jan 29, 1998
Sold by
Dennis Leonard T and Dennis Patricia E
Bought by
Seier Jerry and Seier Lois C
Current Estimated Value
Home Financials for this Owner
Home Financials are based on the most recent Mortgage that was taken out on this home.
Original Mortgage
$125,000
Outstanding Balance
$22,030
Interest Rate
6.95%
Estimated Equity
$579,048
Create a Home Valuation Report for This Property
The Home Valuation Report is an in-depth analysis detailing your home's value as well as a comparison with similar homes in the area
Home Values in the Area
Average Home Value in this Area
Purchase History
| Date | Buyer | Sale Price | Title Company |
|---|---|---|---|
| Seier Jerry | $165,000 | -- |
Source: Public Records
Mortgage History
| Date | Status | Borrower | Loan Amount |
|---|---|---|---|
| Open | Seier Jerry | $125,000 |
Source: Public Records
Tax History Compared to Growth
Tax History
| Year | Tax Paid | Tax Assessment Tax Assessment Total Assessment is a certain percentage of the fair market value that is determined by local assessors to be the total taxable value of land and additions on the property. | Land | Improvement |
|---|---|---|---|---|
| 2025 | $9,144 | $449,100 | $149,400 | $299,700 |
| 2024 | $8,780 | $449,100 | $149,400 | $299,700 |
| 2023 | $8,780 | $449,100 | $149,400 | $299,700 |
| 2022 | $8,996 | $328,800 | $182,500 | $146,300 |
| 2021 | $8,996 | $328,800 | $182,500 | $146,300 |
| 2020 | $8,845 | $328,800 | $182,500 | $146,300 |
| 2019 | $8,664 | $328,800 | $182,500 | $146,300 |
| 2018 | $8,644 | $328,800 | $182,500 | $146,300 |
| 2017 | $8,546 | $328,800 | $182,500 | $146,300 |
| 2016 | $8,529 | $328,800 | $182,500 | $146,300 |
| 2015 | $8,381 | $328,800 | $182,500 | $146,300 |
| 2014 | $8,286 | $328,800 | $182,500 | $146,300 |
Source: Public Records
Map
Nearby Homes
- 537 Dell Rd
- 649 Henmar Dr
- 512 Colver Rd
- 545 Rogers Dr
- 504 Ryerson Rd
- 592 Dell Rd
- 547 Atlas Rd
- 505 Logan Dr
- 627 E Vail Rd
- 21 Laurie Rd
- 5 Zachary Dr
- 15 Auriemma Ct
- 100 Zachary Way Unit 100
- 33 Ford Rd Unit 35
- 16 Esposito Ln
- 203 Howard Blvd
- 86 Brookside Ln
- 90 Salmon Rd
- 11 Zachary Way
- 24 Bertrand Island Rd