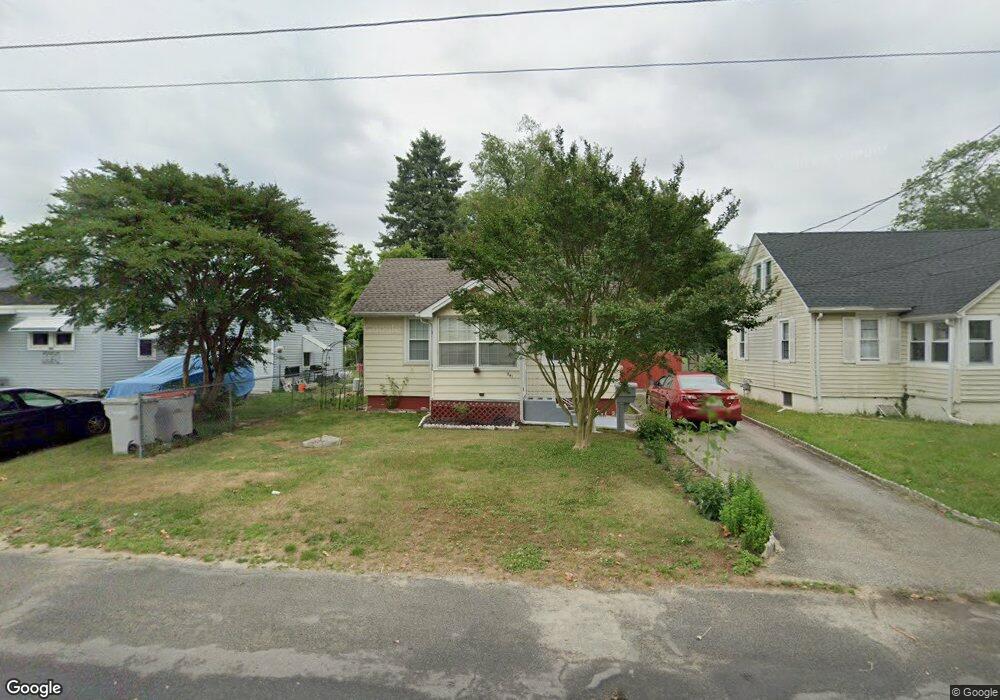
541 N 2nd St Vineland, NJ 08360
Estimated Value: $148,401 - $218,000
--
Bed
--
Bath
690
Sq Ft
$269/Sq Ft
Est. Value
About This Home
This home is located at 541 N 2nd St, Vineland, NJ 08360 and is currently estimated at $185,350, approximately $268 per square foot. 541 N 2nd St is a home located in Cumberland County with nearby schools including Max Leuchter Elementary School, T.W. Wallace Middle School, and Vineland Senior High School.
Ownership History
Date
Name
Owned For
Owner Type
Purchase Details
Closed on
May 21, 2004
Sold by
Gomez Nancy
Bought by
Bruno Angel
Current Estimated Value
Home Financials for this Owner
Home Financials are based on the most recent Mortgage that was taken out on this home.
Original Mortgage
$82,400
Outstanding Balance
$39,826
Interest Rate
5.94%
Estimated Equity
$145,524
Purchase Details
Closed on
Jul 31, 1996
Sold by
Swain Harry R and Swain Catherine
Bought by
Gomez Mariano A and Gomez Nancy
Home Financials for this Owner
Home Financials are based on the most recent Mortgage that was taken out on this home.
Original Mortgage
$61,450
Interest Rate
8.27%
Mortgage Type
FHA
Purchase Details
Closed on
Oct 11, 1995
Sold by
Swain Harry and Swain Catherine
Bought by
Swain Catherine
Purchase Details
Closed on
Aug 2, 1995
Sold by
Swain Harry
Bought by
Swain Harry and Swain Catherine
Create a Home Valuation Report for This Property
The Home Valuation Report is an in-depth analysis detailing your home's value as well as a comparison with similar homes in the area
Home Values in the Area
Average Home Value in this Area
Purchase History
| Date | Buyer | Sale Price | Title Company |
|---|---|---|---|
| Bruno Angel | $103,000 | -- | |
| Gomez Mariano A | $61,500 | Landis Title Corporation | |
| Swain Catherine | -- | -- | |
| Swain Harry | -- | -- | |
| Swain Harry | -- | -- |
Source: Public Records
Mortgage History
| Date | Status | Borrower | Loan Amount |
|---|---|---|---|
| Open | Bruno Angel | $82,400 | |
| Previous Owner | Gomez Mariano A | $61,450 |
Source: Public Records
Tax History Compared to Growth
Tax History
| Year | Tax Paid | Tax Assessment Tax Assessment Total Assessment is a certain percentage of the fair market value that is determined by local assessors to be the total taxable value of land and additions on the property. | Land | Improvement |
|---|---|---|---|---|
| 2025 | $2,461 | $77,300 | $24,000 | $53,300 |
| 2024 | $2,461 | $77,300 | $24,000 | $53,300 |
| 2023 | $2,445 | $77,300 | $24,000 | $53,300 |
| 2022 | $2,372 | $77,300 | $24,000 | $53,300 |
| 2021 | $2,079 | $77,300 | $24,000 | $53,300 |
| 2020 | $2,263 | $77,300 | $24,000 | $53,300 |
| 2019 | $2,232 | $77,300 | $24,000 | $53,300 |
| 2018 | $2,173 | $77,300 | $24,000 | $53,300 |
| 2017 | $2,064 | $77,300 | $24,000 | $53,300 |
| 2016 | $1,991 | $77,300 | $24,000 | $53,300 |
| 2015 | $1,918 | $77,300 | $24,000 | $53,300 |
| 2014 | $1,813 | $77,300 | $24,000 | $53,300 |
Source: Public Records
Map
Nearby Homes
- 108 W Park Ave
- 550 Northwest Ave
- 330 W Peach St
- 400 N 7th St
- 636 E Pear St
- 329 W Grape St
- 218 W Montrose St
- 404 Montrose St
- 663 Wayne Ave
- 511 E Grape St
- 0 W Landis Ave
- 818 E Pear St
- 409 N East Ave
- 411 N East Ave
- 1298 W Cornell St
- 1267 Northeast Blvd
- 1489 N Delsea Dr
- 48 N Myrtle St
- 1252 W Oak Rd
- 724 E Grape St