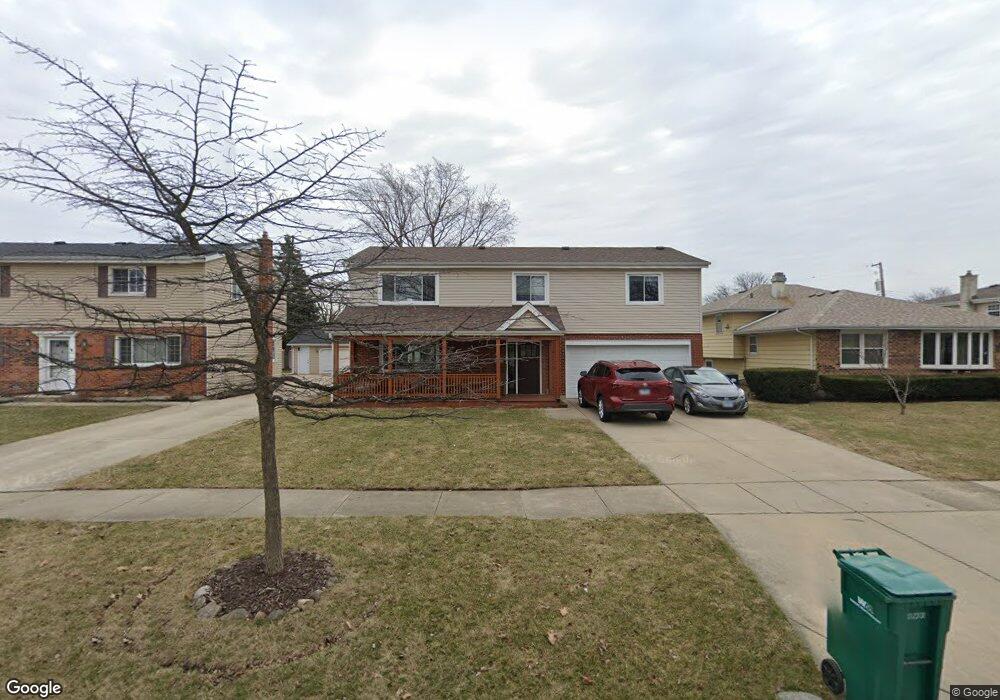
541 N Clarendon Ave Lombard, IL 60148
North Lombard NeighborhoodEstimated Value: $411,000 - $485,000
--
Bed
--
Bath
1,876
Sq Ft
$237/Sq Ft
Est. Value
About This Home
This home is located at 541 N Clarendon Ave, Lombard, IL 60148 and is currently estimated at $445,220, approximately $237 per square foot. 541 N Clarendon Ave is a home located in DuPage County with nearby schools including Schafer Elementary School, Jefferson Middle School, and Willowbrook High School.
Ownership History
Date
Name
Owned For
Owner Type
Purchase Details
Closed on
Oct 24, 2023
Sold by
Kovacs Christopher R and Kovacs Janet
Bought by
Kovacs Living Trust and Kovacs
Current Estimated Value
Purchase Details
Closed on
Nov 6, 2002
Sold by
Kovacs Janet and Felbinger Janet
Bought by
Kovacs Christopher R and Kovacs Janet
Purchase Details
Closed on
Apr 23, 2002
Sold by
Harman Robert and Ambrosia Joan
Bought by
Felbinger Janet
Home Financials for this Owner
Home Financials are based on the most recent Mortgage that was taken out on this home.
Original Mortgage
$180,500
Interest Rate
6.87%
Purchase Details
Closed on
Jun 15, 2000
Sold by
Ahlquist Elaine J
Bought by
Harman Robert and Ambrosia Joan
Home Financials for this Owner
Home Financials are based on the most recent Mortgage that was taken out on this home.
Original Mortgage
$165,133
Interest Rate
8.31%
Mortgage Type
FHA
Create a Home Valuation Report for This Property
The Home Valuation Report is an in-depth analysis detailing your home's value as well as a comparison with similar homes in the area
Home Values in the Area
Average Home Value in this Area
Purchase History
| Date | Buyer | Sale Price | Title Company |
|---|---|---|---|
| Kovacs Living Trust | -- | None Listed On Document | |
| Kovacs Christopher R | -- | -- | |
| Felbinger Janet | $190,000 | Prairie Title | |
| Harman Robert | $170,000 | Djh Title & Abstract |
Source: Public Records
Mortgage History
| Date | Status | Borrower | Loan Amount |
|---|---|---|---|
| Previous Owner | Felbinger Janet | $180,500 | |
| Previous Owner | Harman Robert | $165,133 |
Source: Public Records
Tax History Compared to Growth
Tax History
| Year | Tax Paid | Tax Assessment Tax Assessment Total Assessment is a certain percentage of the fair market value that is determined by local assessors to be the total taxable value of land and additions on the property. | Land | Improvement |
|---|---|---|---|---|
| 2024 | $8,602 | $124,815 | $21,347 | $103,468 |
| 2023 | $8,201 | $115,420 | $19,740 | $95,680 |
| 2022 | $7,926 | $110,960 | $18,980 | $91,980 |
| 2021 | $7,656 | $108,200 | $18,510 | $89,690 |
| 2020 | $7,496 | $105,820 | $18,100 | $87,720 |
| 2019 | $7,058 | $100,610 | $17,210 | $83,400 |
| 2018 | $6,641 | $90,700 | $15,510 | $75,190 |
| 2017 | $6,702 | $89,250 | $19,210 | $70,040 |
| 2016 | $6,615 | $84,080 | $18,100 | $65,980 |
| 2015 | $6,303 | $78,330 | $16,860 | $61,470 |
| 2014 | $6,101 | $75,630 | $20,990 | $54,640 |
| 2013 | $6,008 | $76,700 | $21,290 | $55,410 |
Source: Public Records
Map
Nearby Homes
- 434 N Lincoln Ave
- 630 E Le Moyne Ave
- 530 N Fairfield Ave
- 439 N Fairfield Ave
- 937 W North Ave Unit C
- 933 W North Ave Unit A
- 700 W Pleasant St
- 2N000 Vista Ave
- 343 E North Ave
- 231 E Berkshire Ave
- 131 N Chase Ave
- 739 N 2nd Ave
- 354 N 3rd Ave
- 252 N Lombard Ave
- 417 W Terrace St
- 736 E Saint Charles Rd
- 506 N Garfield St
- 912 E Saint Charles Rd
- 201 N Stewart Ave
- 935 E Saint Charles Rd
- 547 N Clarendon Ave
- 537 N Clarendon Ave
- 533 N Clarendon Ave
- 707 E Sunset Ave
- 542 N Kramer Ave
- 548 N Kramer Ave
- 536 N Kramer Ave
- 527 N Clarendon Ave
- 542 N Clarendon Ave
- 548 N Clarendon Ave
- 536 N Clarendon Ave
- 554 N Kramer Ave
- 530 N Kramer Ave
- 530 N Clarendon Ave
- 525 N Clarendon Ave
- 524 N Kramer Ave
- 635 E Sunset Ave
- 524 N Clarendon Ave
- 518 N Kramer Ave
- 521 N Clarendon Ave